Moneyta Research: A Research Desk That Shows Its Work
What is AI stock research you can actually check? Moneyta Research puts five AI analysts on the published evidence, makes a bull and a bear argue over every claim, and then names the specific events that would prove the read wrong. Here is how it works and what you get.

Ask a chatbot about a stock and you get a confident paragraph. You cannot see where any of it came from, you cannot tell what it left out, and if you ask again tomorrow you get a different paragraph with the same confidence. That is not research. That is a well-written guess.
We built Moneyta Research to work the way a real research desk works. Analysts read source documents. Someone argues the other side. A chair decides what survives. And the whole thing is written down so you can check it. Here is what that looks like in practice.
Five analysts, one slice of evidence each
A read starts by gathering the published evidence: the numbers a company files with the SEC, the filings themselves, price history we compute ourselves, which funds hold the name, and recent headlines. Then five AI analysts go to work, and each one sees only its own slice.
- Mercer reads the XBRL figures filed with the SEC: revenue, margins, income, debt, share count, quarter by quarter.
- Oakes reads the filings themselves, above all the year over year diff of the risk factors section: which risks a company added, dropped, or quietly reworded.
- Nash reads the market signals: momentum, volatility, drawdown, relative strength, beta, each ranked against the whole research universe rather than judged alone.
- Ellis reads which funds hold the name and at what weight, plus insider filings, so you can see the exposure you may already carry through index funds.
- Yates reads headlines that are genuinely about this company, with rating chatter and market-wide stories filtered out.
The split is the point. No analyst can borrow another's conclusion, and none of them can browse the web or lean on something half-remembered from training. Every claim has to cite a source you can open. A claim that cites nothing gets dropped before anyone sees it.
Then a bull and a bear argue about it
The analysts hand their claims to a two round debate. A bull argues the favorable case, a bear argues the other one, and a chair rules on each claim individually: upheld, weakened, or dropped. Only what survives feeds the final read, and weakened claims count for half.
The argument is shown, not hidden. You can read what the bear said about the exact claim you were about to rely on. When a claim gets weakened because the same pattern shows up across most of the market, you see that reasoning too, in the chair's own words.
The desk names what would prove it wrong
This is the part we are proudest of, and the part most research skips. Every read ends with a short list of specific, checkable events that would break it. Not vague hedging like "macro conditions could change". Concrete things, tied to levels the evidence already contains.

We enforce this in code, not just in the prompt. The desk can only cite levels that came out of the evidence it actually read, and every one of them has to point at a claim that survived the debate. If it tries to invent a level, we drop it rather than print it.
Then we watch them for you. Each weekday morning we check the ones that can be checked automatically against the newest close and signals. If one happens, you hear about it, because the honest response to a stated risk materialising is to go back and read again.
What changed since you last looked
A new report only exists when the evidence moved. That sounds like a small design decision and it is actually the whole basis for an honest comparison: when two reads differ, they differ because the world changed, not because the model felt different that day.
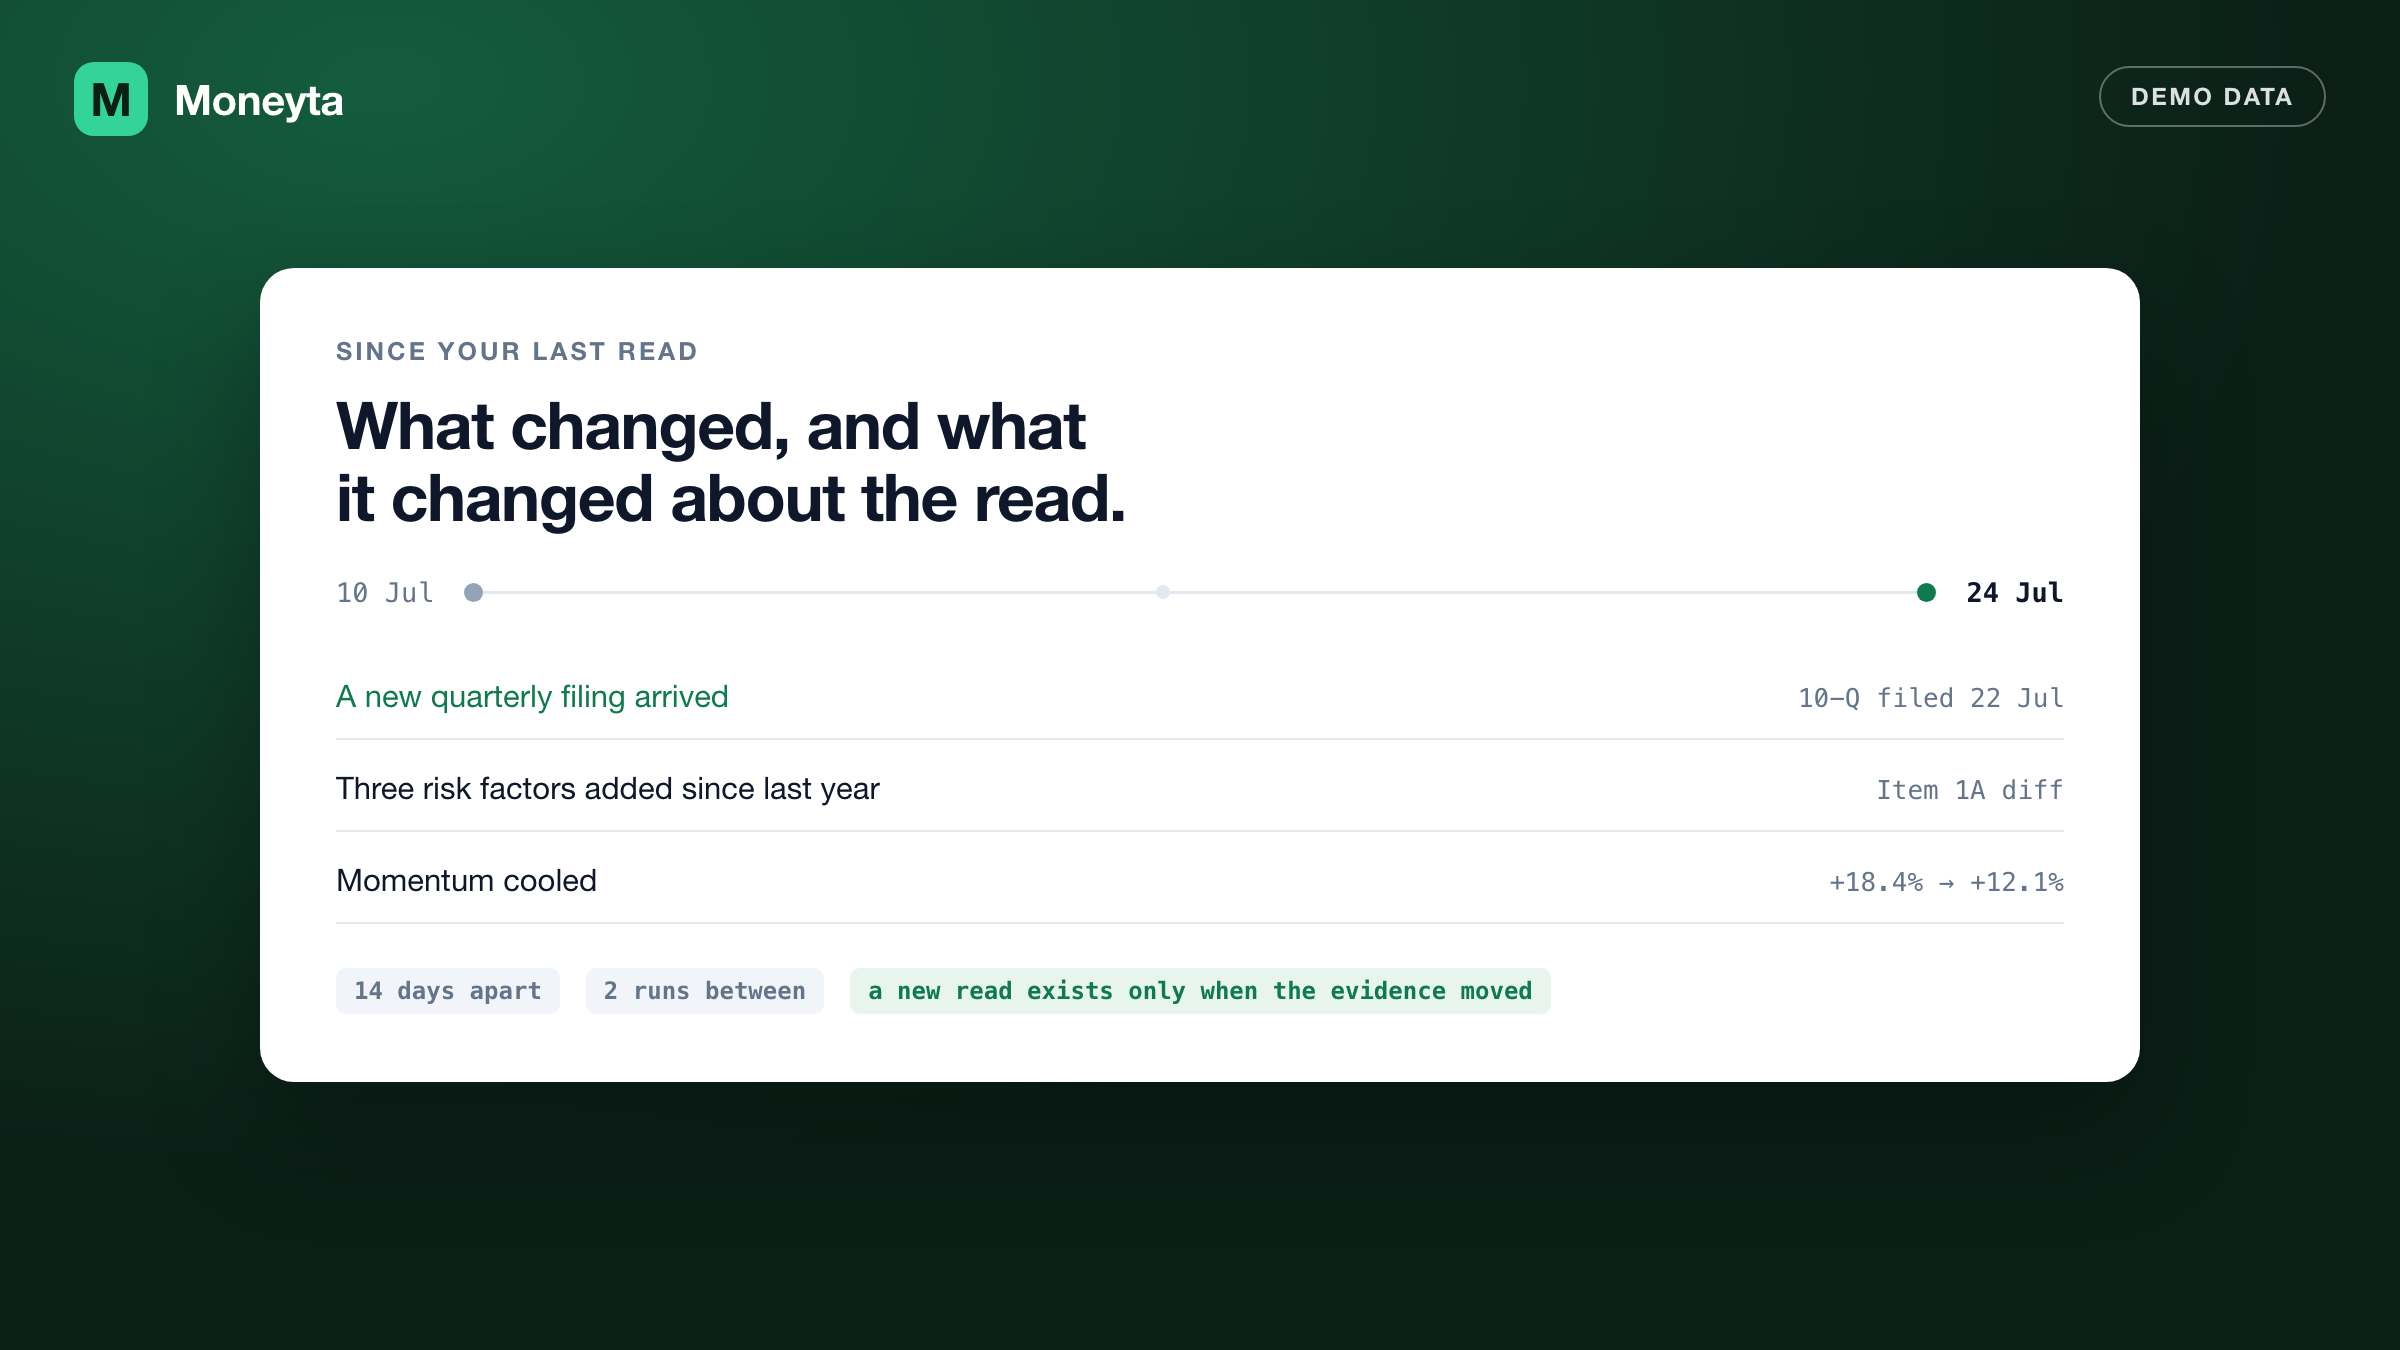
So the page opens with one quiet line: since your last read, here is what arrived and here is whether the read moved because of it. Expand it and you get the new filings, the added risk factors, the signals that rolled, and where the score movement came from, component by component.
It also refuses to compare things that are not comparable. When we improve how the score is computed, older reads were built under the old method, so we show you both numbers separately rather than drawing a change between them that would not mean anything. Gaps on the timeline are information too: a stretch with no new read is a quiet stretch, not missing data. Click any date to open that read as it stood.
A record of what the desk actually did
A finished report carries a timestamped log of the run that produced it. Which analyst reported when, how many claims each raised, what the chair ruled, how long the whole thing took.
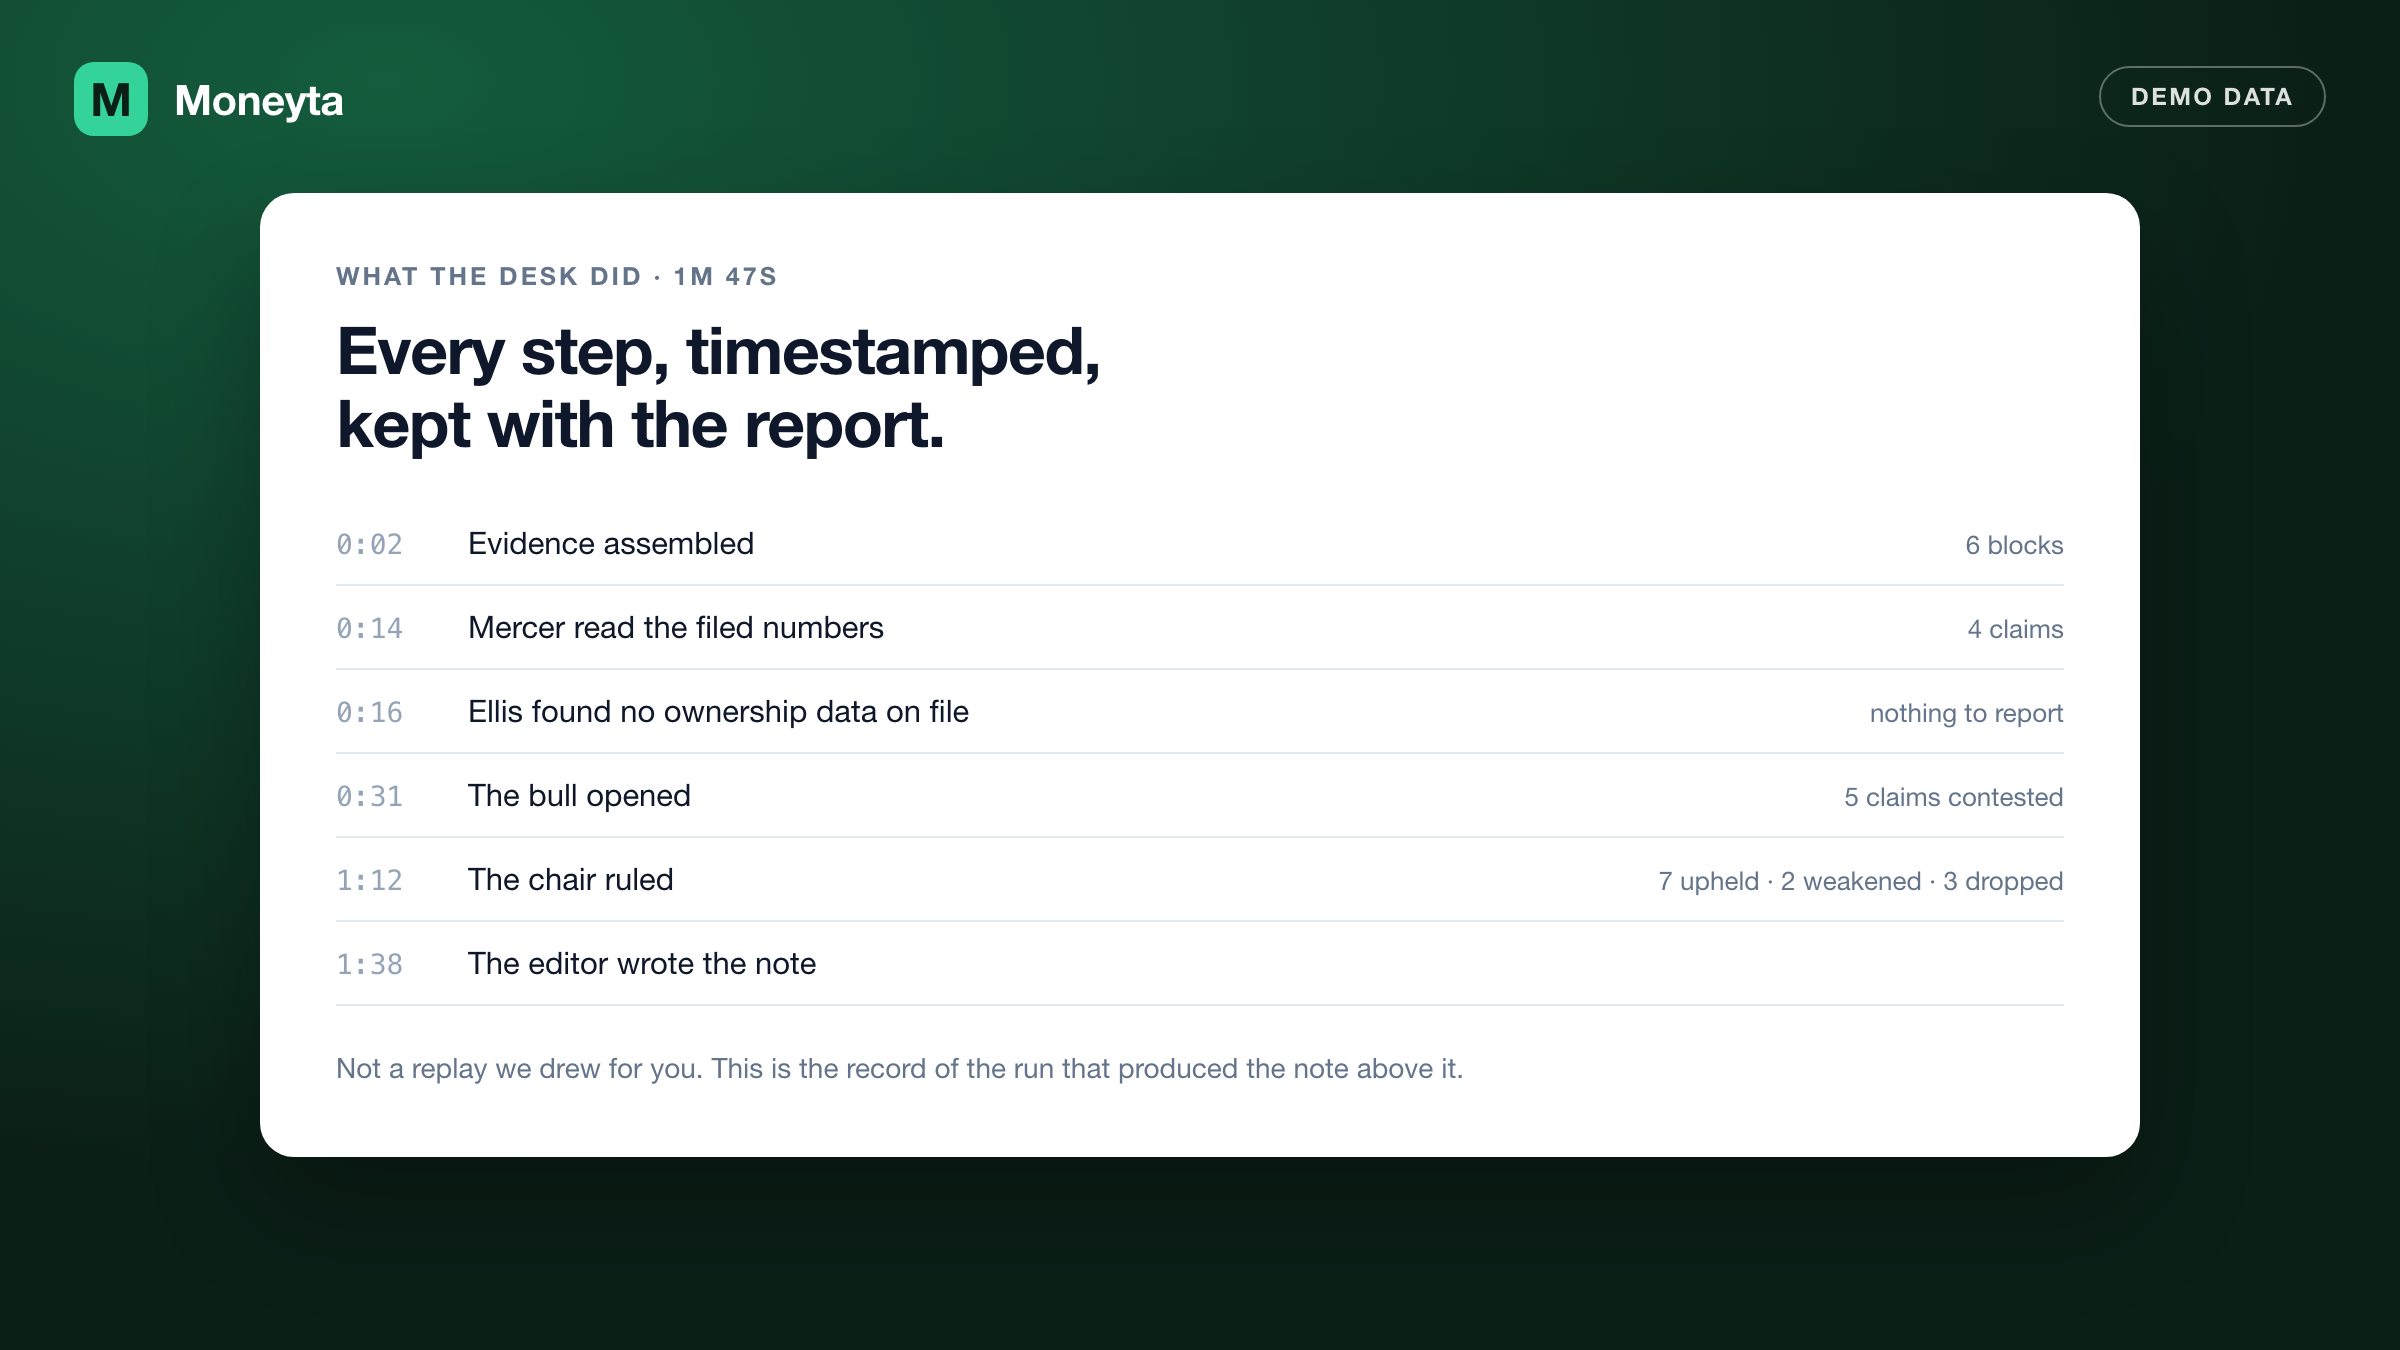
We think you should be able to answer "can I trust this?" by looking rather than by taking our word for it. So the answer is the log, the debate, the comparison, and the sourcing on every claim. It is deliberately not a self-assessed accuracy score, because a number we grade ourselves is exactly the kind of thing this product exists to avoid.
When the desk cannot see something, it says so
Sometimes an analyst has nothing to report. A company that files under international standards has no quarterly US filings for Mercer to read. A recently listed company has too little price history for Nash. That silence is real information and we show it plainly.
What matters more is the distinction we draw next to it. "There is nothing to find" and "we could not check" are different sentences, and only one of them is a fact about the company. If a data provider was down when we assembled the evidence, the report says we could not check, never that the company has no coverage. Our gap is our gap.
The same rule runs through everything: absence is never rendered as a number, every figure carries the date it was true, and anything we computed rather than argued is labelled as computed.
What you get
- A read on any covered company, built from published evidence, in about two minutes, with the desk's progress visible while you wait.
- Every claim cited to a document you can open, named by what it is and when it was filed.
- A debate you can read, with the chair's ruling on each claim.
- A risk review that quantifies how the read could be wrong, including how much of it rests on a single source.
- A watchlist of specific events that would break the read, checked for you each weekday.
- A comparison against your last read, and the ability to open any earlier one.
None of this tells you what to buy or sell, and it never will. There is no rating, no price target of our own, and third party analyst consensus is shown for context without ever entering our number. What it does is put the published evidence in front of you, argued from both sides, with the reasoning attached, so the judgment stays yours and you can see what it rests on.
Frequently asked questions
What is Moneyta Research?
Moneyta Research is an AI research desk that reads published evidence about a company, five specialist analysts at a time, then puts every claim through a bull and bear debate before a chair rules on it. The result is a dated read where each claim cites a source you can open. It is educational analysis of published data, not investment advice.
How is this different from asking ChatGPT about a stock?
A general chatbot answers from memory and cannot show you where anything came from. Moneyta Research reads only a defined set of published sources, drops any claim that does not cite one of them, argues both sides before counting anything, and keeps a timestamped record of the run. The sentiment number is arithmetic over surviving claims rather than a model's opinion.
What is a falsifier in a research report?
A falsifier is a specific, observable event that would break the read: a close below a named moving average, the next quarterly filing restating a figure, a drawdown past a stated level. Moneyta requires each one to cite a level taken from the evidence the desk actually read, and checks the automatable ones every weekday morning.
Does a new report appear every day?
No. A new report exists only when the underlying evidence has changed, such as a new filing, updated signals, or fresh headlines. That is why two reads can be honestly compared: they differ because the evidence moved, not because the model was re-run. A gap between reads means a quiet stretch, not missing data.
Does Moneyta Research give buy or sell recommendations?
No. There are no ratings, no price targets of our own, and no recommendations of any kind. Third party analyst consensus appears for context only and never enters the Moneyta sentiment score. The product shows you the published evidence and the reasoning over it so you can reach your own conclusions.