
Modern Portfolio Theory for a Real Portfolio, Without the Crystal Ball
Modern portfolio theory is usually taught with a chart of the perfect portfolio. We built a score from the parts of it that hold up with real data, published every cut-off, and made it free.
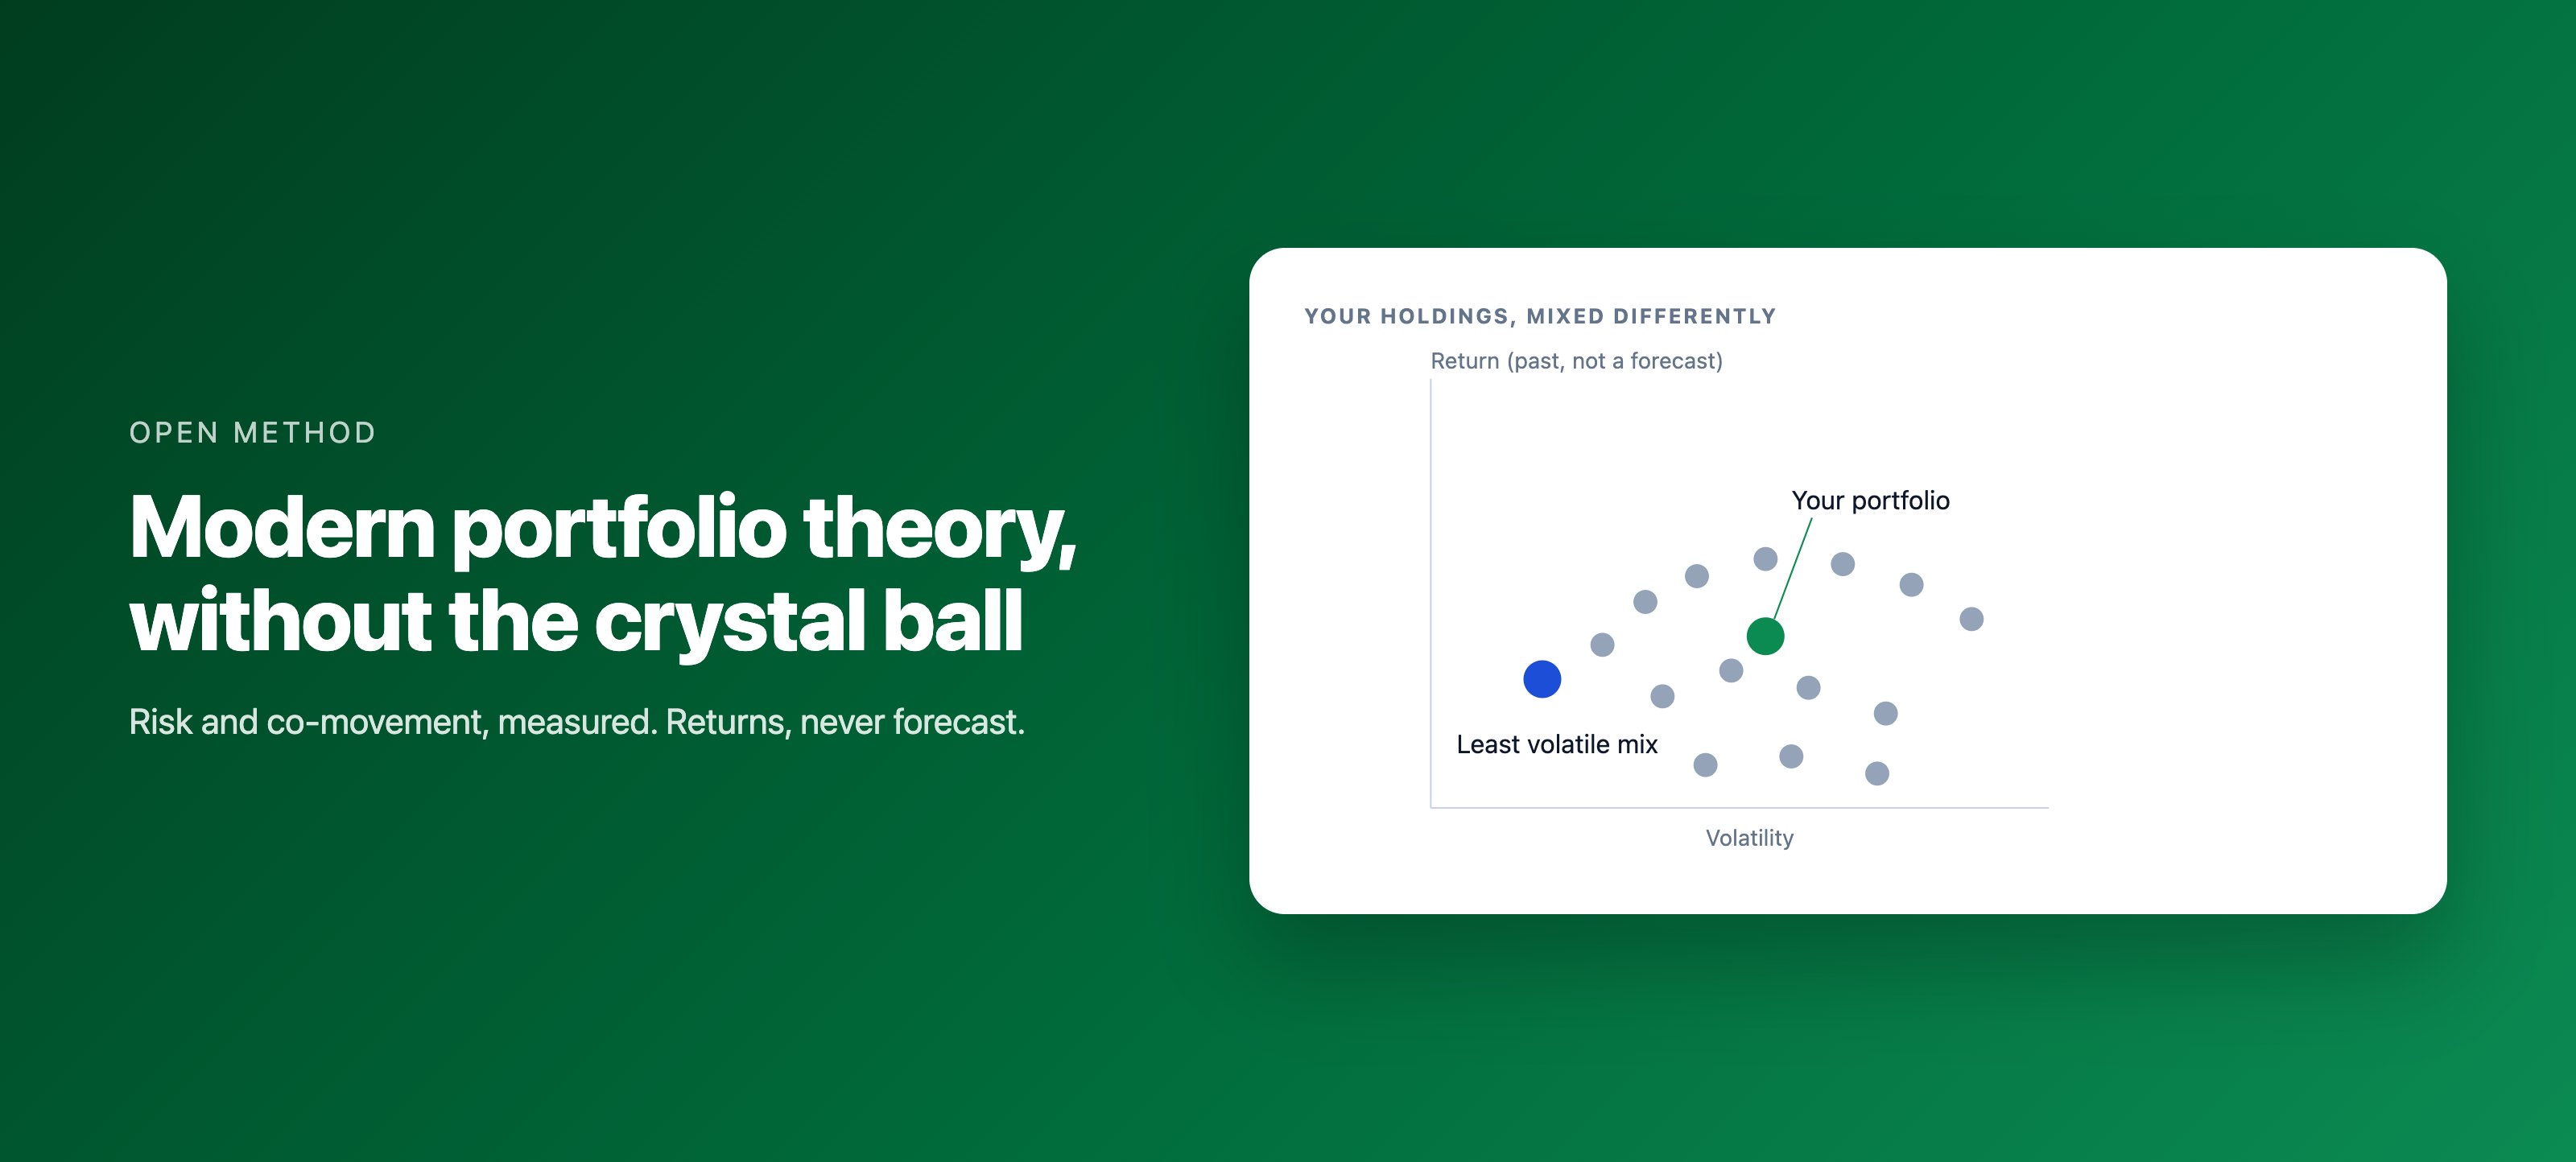
Modern portfolio theory, from Harry Markowitz's 1952 paper, gave investing one of its most useful ideas: what matters is not how risky each holding is on its own, but how they move together. Two volatile holdings that zig when the other zags can make a calmer portfolio than either alone.
It also gave us the efficient frontier, the curve of best possible portfolios, and that is where most real-world use goes wrong. To draw it you need expected returns, and expected returns are the one input nobody can estimate well. Feed a frontier a few years of history and it will tell you to put everything into whatever did best lately.
The parts that hold up
Risk and co-movement can be measured from history far more reliably than returns can be forecast. So most of the score rests on those, and on what actually happened rather than what might:
- Diversification benefit (20%): the weighted average of your holdings' volatility divided by your portfolio's true volatility. 1.0 means no benefit; 1.6 or more scores 100.
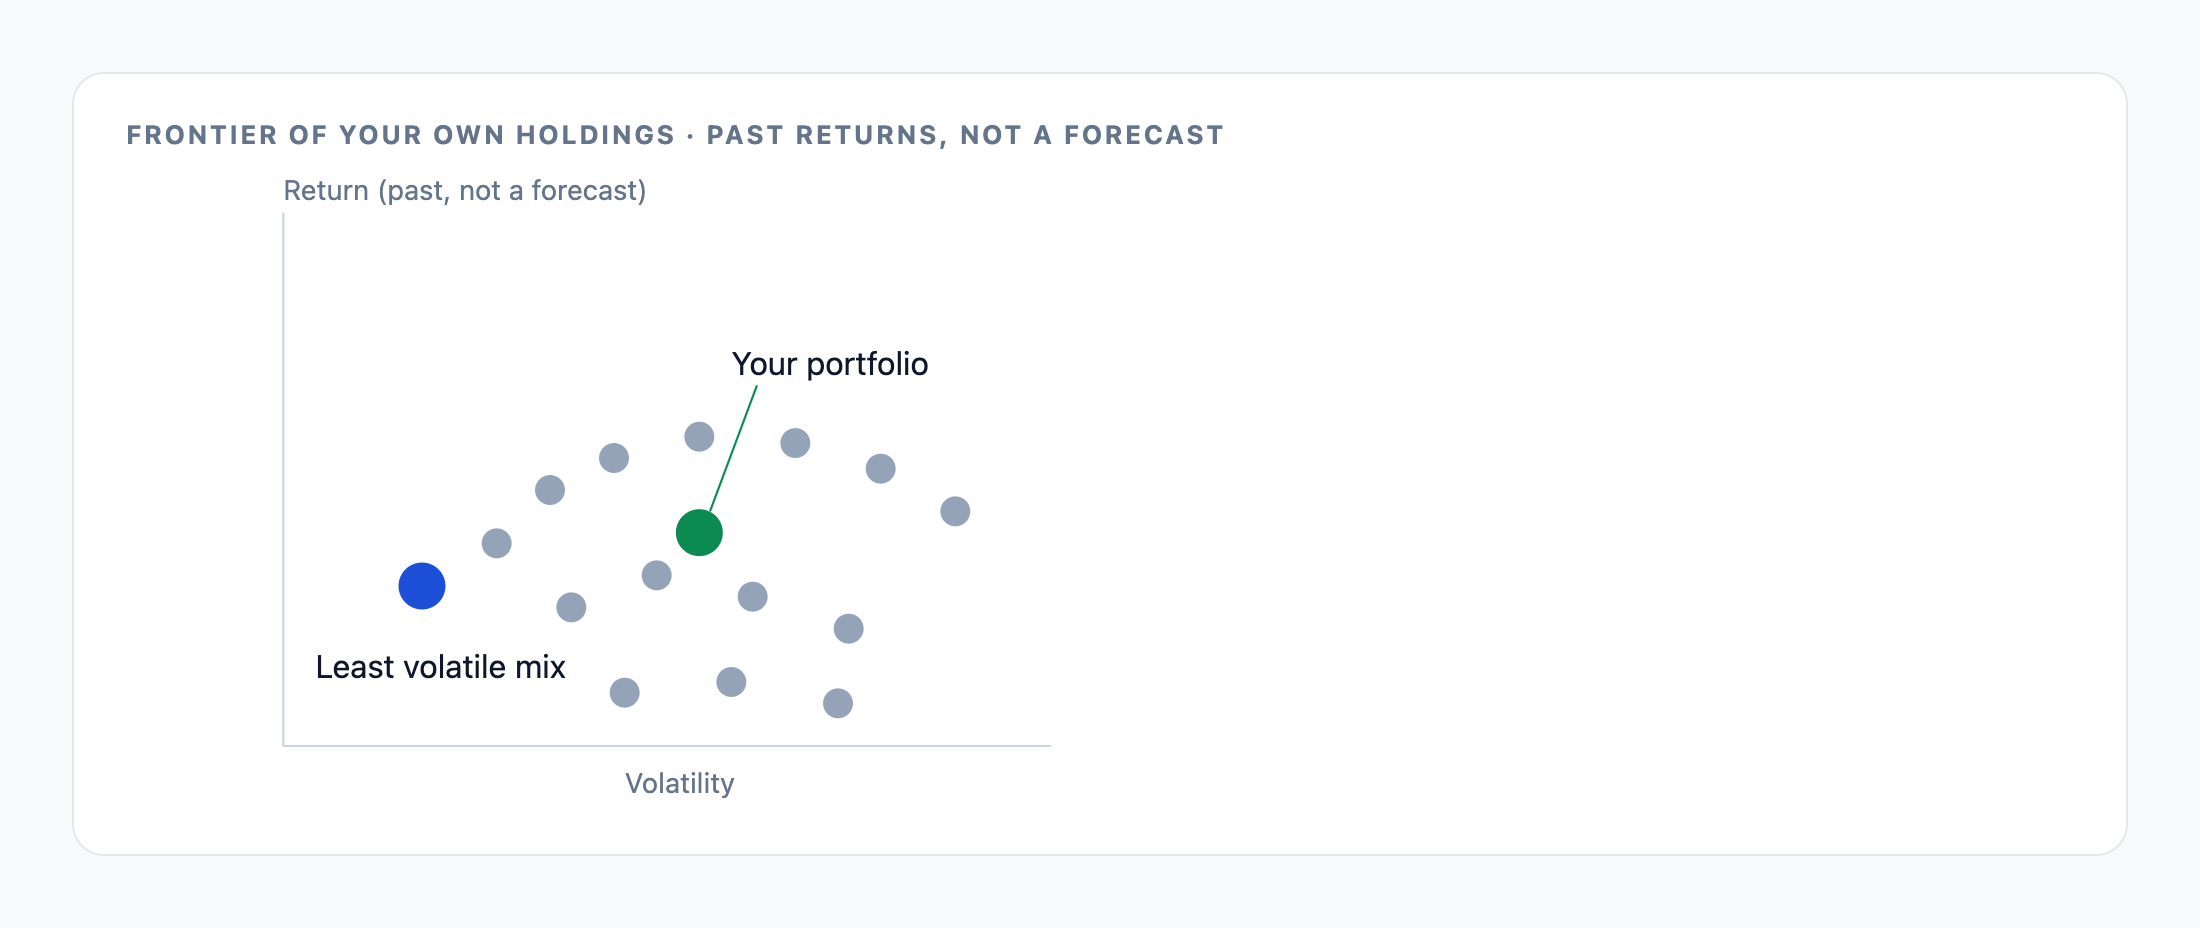
- Risk efficiency (20%): the volatility of the least volatile mix of the same holdings, divided by yours.
- Return per unit of risk (20%): your Sharpe and Sortino ratios against a 60/40 blend of SPY and AGG over the same days, using the Treasury bill rate.
- Drawdown (15%): your worst peak-to-trough fall against the blend's.
- Correlation concentration (10%): how much of your portfolio sits in pairs that move almost in lockstep.
Keeping the best mix, with a leash on it
The last 15% compares your return per unit of risk with the best the same holdings could have reached. To keep it from chasing last year's winner, expected returns are anchored mostly to what the market pays for risk (the Treasury bill rate plus each holding's beta times a 5% equity premium) and only a quarter to its own history, and no holding may take more than a quarter of that best mix. We never show you the mix itself. It is an estimate, not a recommendation.
When it refuses
The score needs a year of shared trading days for at least 80% of your portfolio's value. A new portfolio, or one full of recent listings, gets no MPT number at all, with the reason, rather than a number built on too little data. An honest refusal beats a confident guess.
The MPT score methodEvery factor, weight and cut-offFrequently asked questions
What is Moneyta's MPT score?
A free score from 0 to 100 based on modern portfolio theory. It measures diversification benefit, risk efficiency, return per unit of risk against a 60/40 blend, drawdown, correlation concentration, and how close the portfolio is to the best capped mix of its own holdings.
Does the MPT score use expected returns?
Only for one factor worth 15%, where expected returns are anchored mostly to CAPM and no holding may exceed 25% of the reference mix. The other factors use measured risk and realised returns.
Why might Moneyta not give an MPT score?
The score needs about a year of shared daily prices for at least 80% of the portfolio's value. Without that it refuses and says why.