
What Today's Price Already Believes
Every stock price implies a growth story. Run the discounted cash flow arithmetic in reverse and you can read it: the free cash flow growth rate today's price would need to justify itself. Here is how implied expectations work, from the company's own filings.
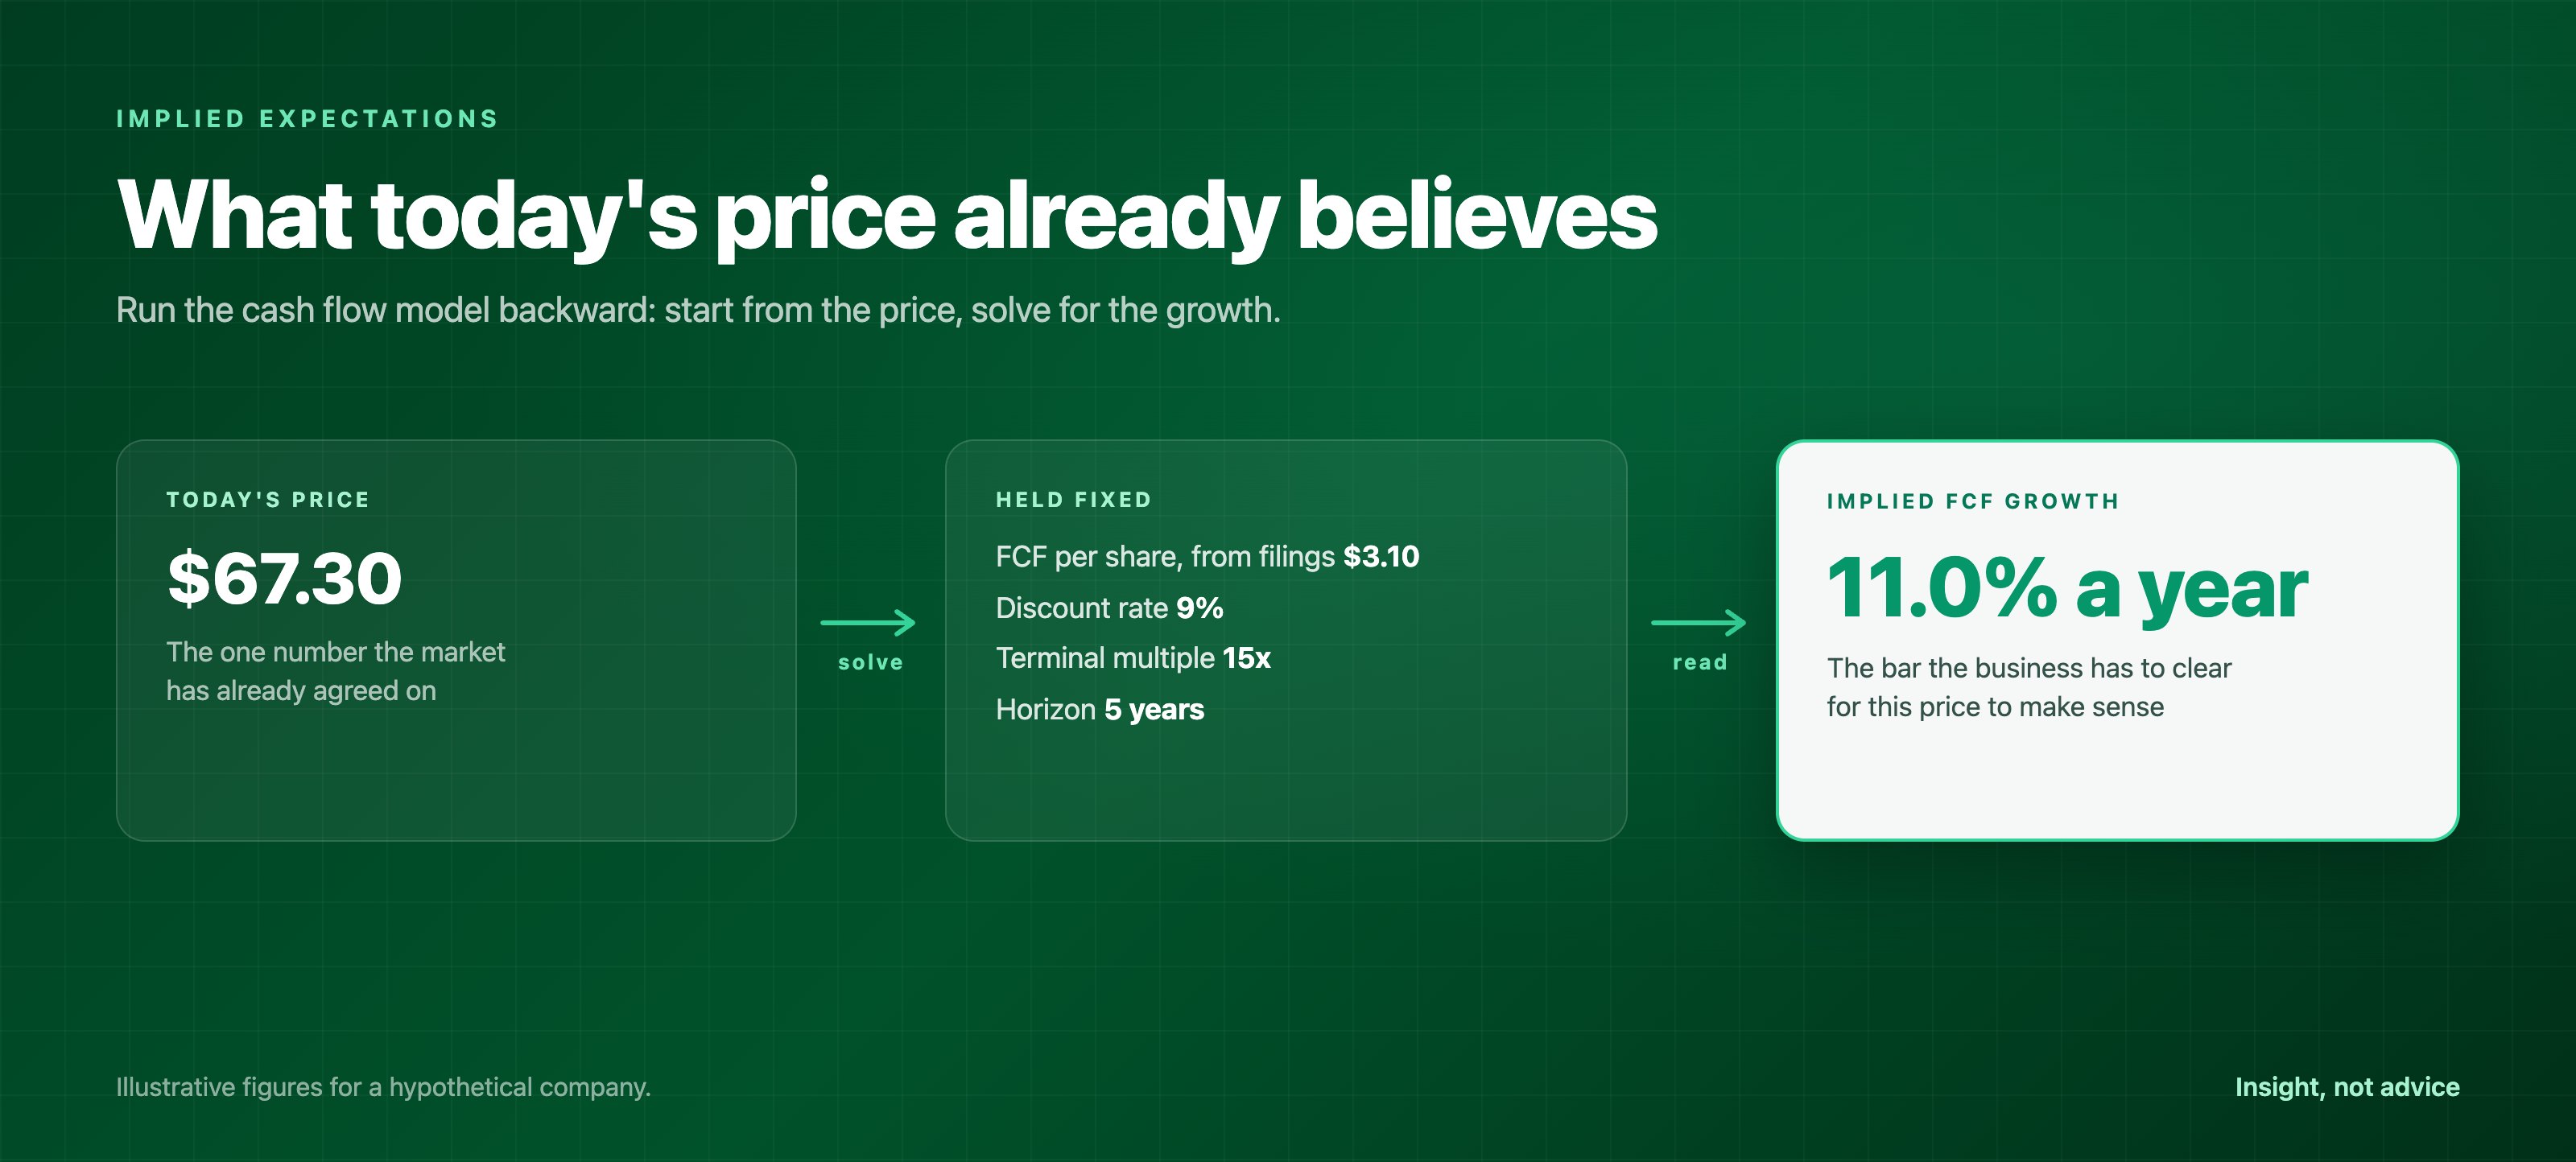
Ask what a stock is worth and you start an argument. Ask what its price already assumes and you start a calculation. That inversion is the most honest way we know to use a valuation model, and it is how Moneyta's new valuation panel leads.
The arithmetic, forward
A discounted cash flow model prices a stock in three moves. Take the company's free cash flow per share: operating cash flow minus capital spending, both straight from its SEC filings, divided by the weighted average diluted share count. Grow it for some years at an assumed rate. Discount every future dollar back to today, and add a terminal value for everything after the horizon.
Every input is either filed fact or stated assumption. The filed facts we take as the company reported them. The assumptions are the argument, and hiding them is how valuation models mislead.
The arithmetic, in reverse
Run the same model backward. Hold the discount rate and terminal multiple fixed, and solve for the one growth rate that makes the model's answer equal today's price. That number is the market's implied expectation. If a stock trades at a price that requires 11% yearly free cash flow growth for five years, then buying it at that price is, arithmetically, a bet that the business clears that bar.
The question stops being what is this worth, which nobody can answer, and becomes is that bar plausible for this business, which you can actually reason about: against its own history, its industry, and its size.
What we show, and what we refuse to
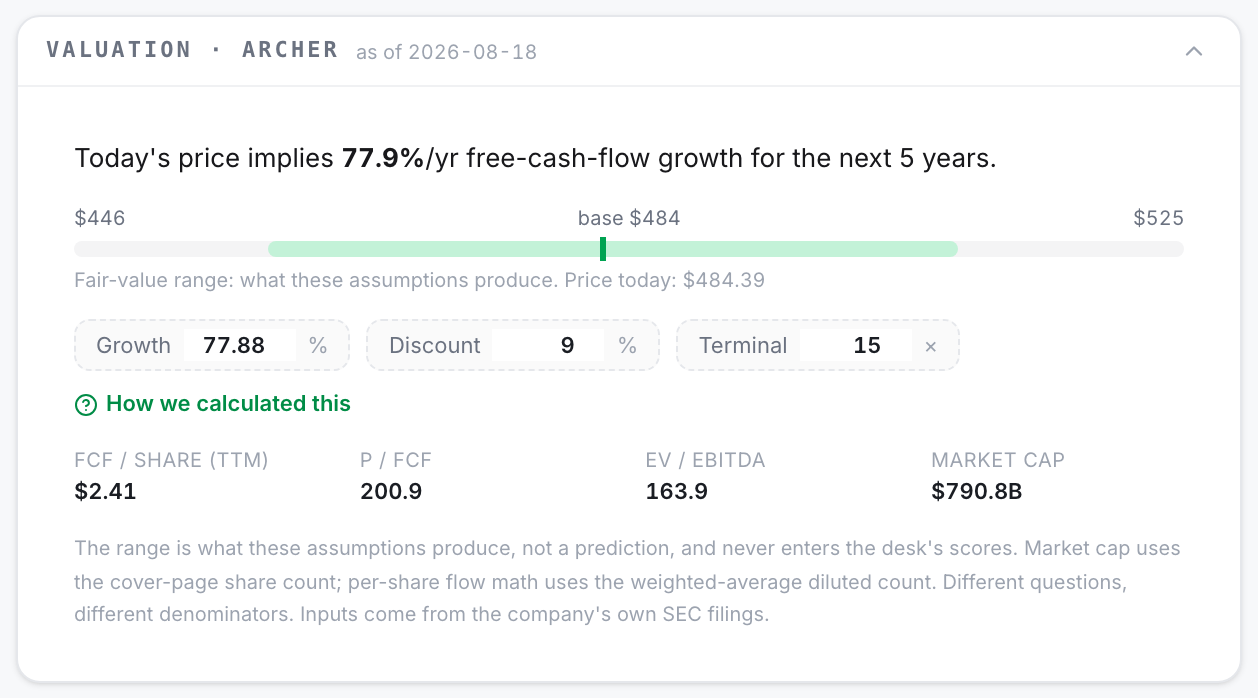
- The implied growth rate leads the panel. It is a market-derived observation, not a target.
- The dollar range below it is labeled what these assumptions produce. Edit the growth, discount, or terminal assumptions and it recomputes instantly. It is never a prediction.
- Every input carries its source: which filing concept, which quarters, which share count. The walkthrough shows the arithmetic with your numbers in it.
- Where the filings do not carry what the model needs, the panel says so instead of guessing. Many foreign filers report no comparable capital spending line, so no free cash flow claim is made for them.
One denominator subtlety worth knowing: market capitalization uses the point-in-time share count from the filing cover page, while per-share cash flow uses the weighted average diluted count. They answer different questions, and quietly swapping them misstates every per-share figure.
Every new account starts with 14 days of Gold: every feature on, no card. Then Free, unless you choose a plan.
Frequently asked questions
Is implied growth a forecast?
No. It is the growth rate that would justify today's price under stated assumptions. It describes what the market's price implies, not what will happen.
Why does the panel sometimes show no fair value range?
The model needs four quarters of both operating cash flow and capital spending from the filings. When they are not on record, the panel says so rather than substituting a guess.