Learn · walkthrough
Look Up What a Signal Is Actually Worth
Published · 7 min read
Before you act on any market signal, momentum, insider buying, a high dividend yield, there is one question worth ten minutes: what actually happened, historically, every time this setup appeared? Moneyta's evidence pages publish that answer for every signal we surface. This walkthrough shows you how to pull the number for a signal, using momentum as the example. How to interpret what you find is its own skill, covered in How to Read a Base Rate.
Step 1: open the evidence index
Click Evidence in the site navigation, or go to moneyta.co/evidence. No account is needed. Each card (1) is one signal, described in plain language. The stat line (2) is the whole story in three numbers: how many times the signal fired, the median six-month result versus the S&P 500, and how often it beat the index.
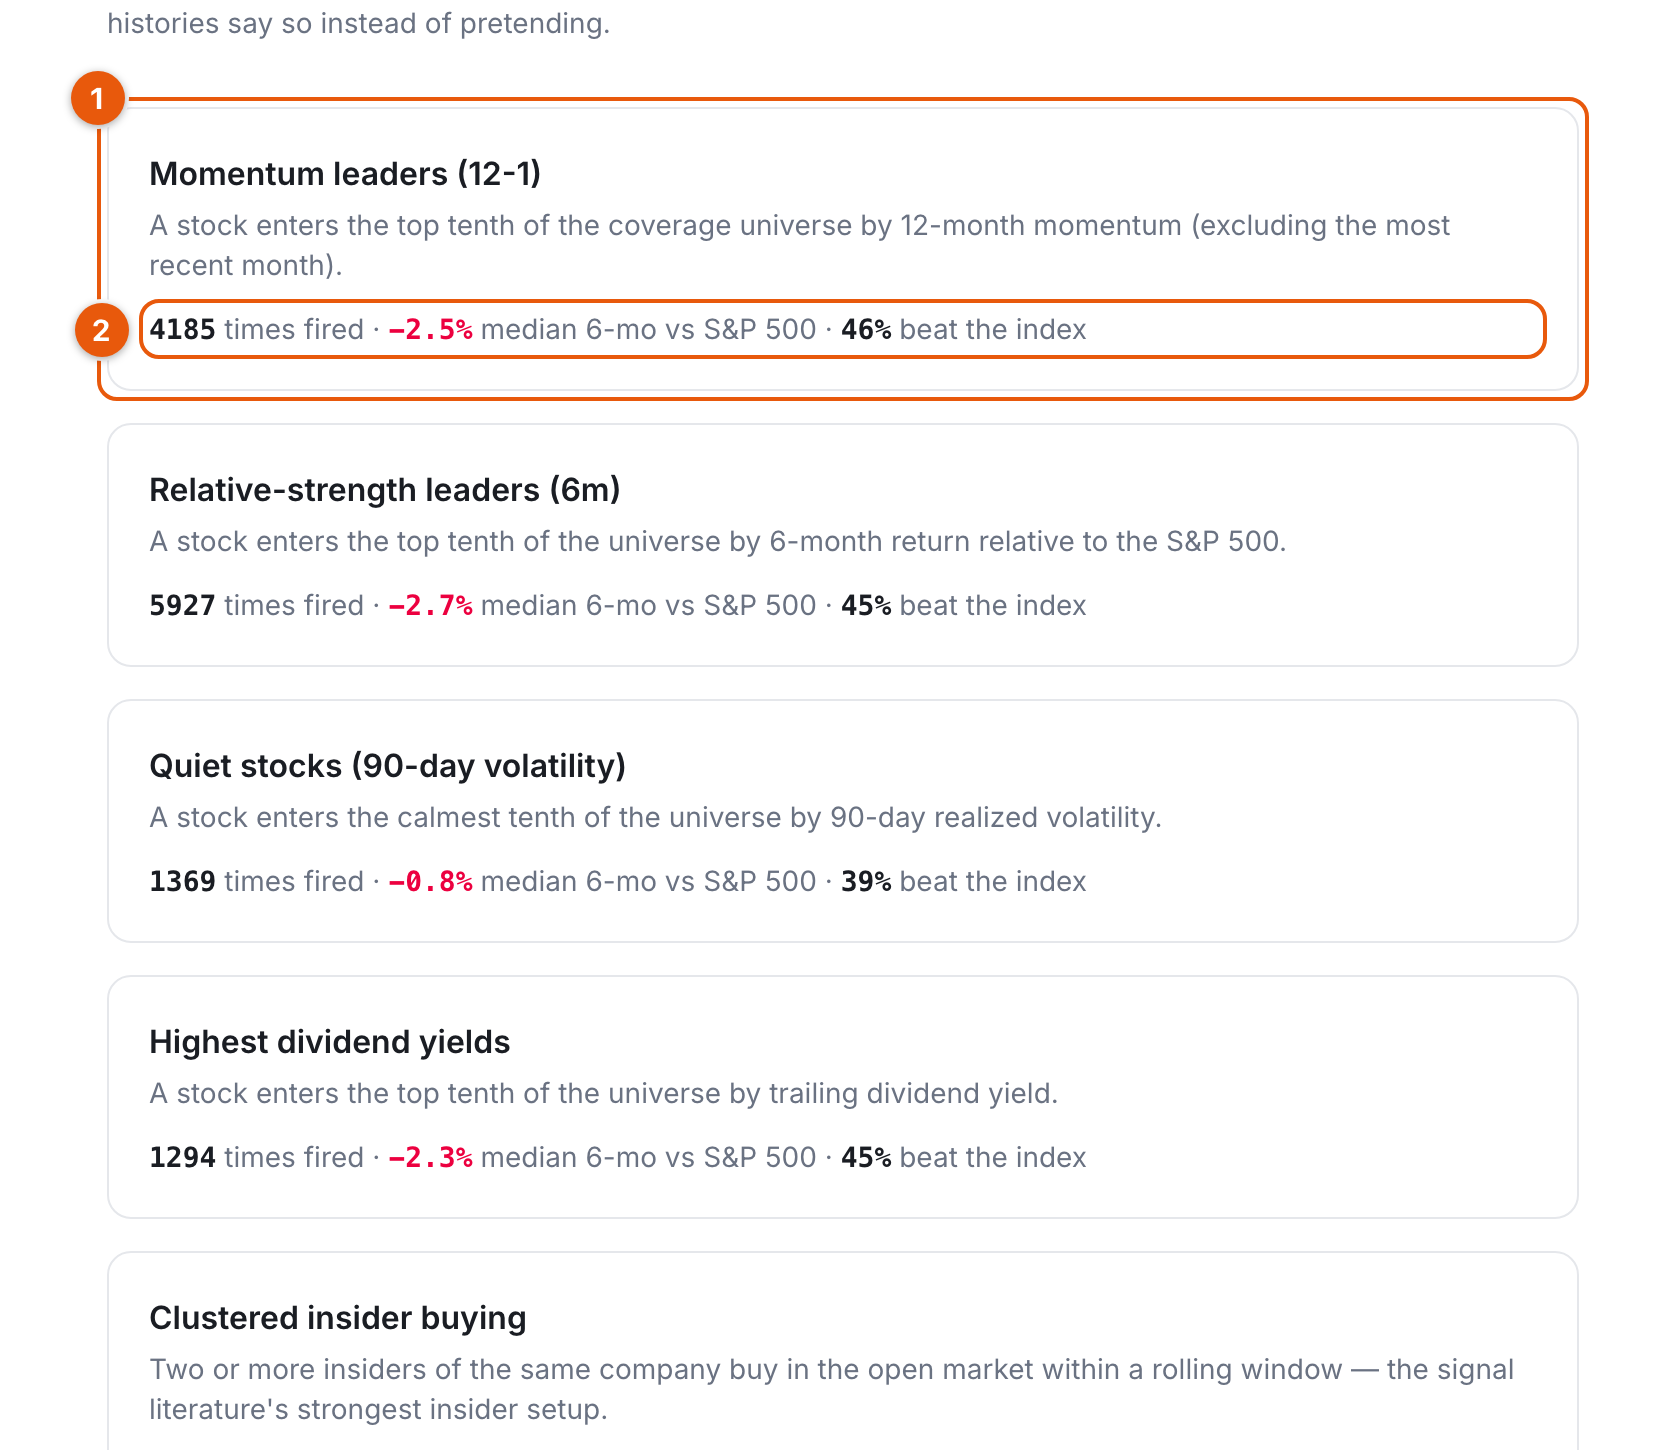
Notice what the index page is willing to say. Several signals show a negative median. One card may say "2 events, history accruing" instead of a rate. Both are deliberate: the page reports what the data shows, not what a marketing page would prefer.
Step 2: open a signal and read the three numbers
Click the momentum card. The signal page leads with three stat cards. Times fired (1) is the sample size, and it is the first number to check: 4,185 closed events is a rate you can reason with. Median six-month excess (2) is the typical outcome across every firing, measured against the S&P 500 over the exact same days. Beat the index (3) is the hit rate, stated with its complement so a 46% never reads better than it is.
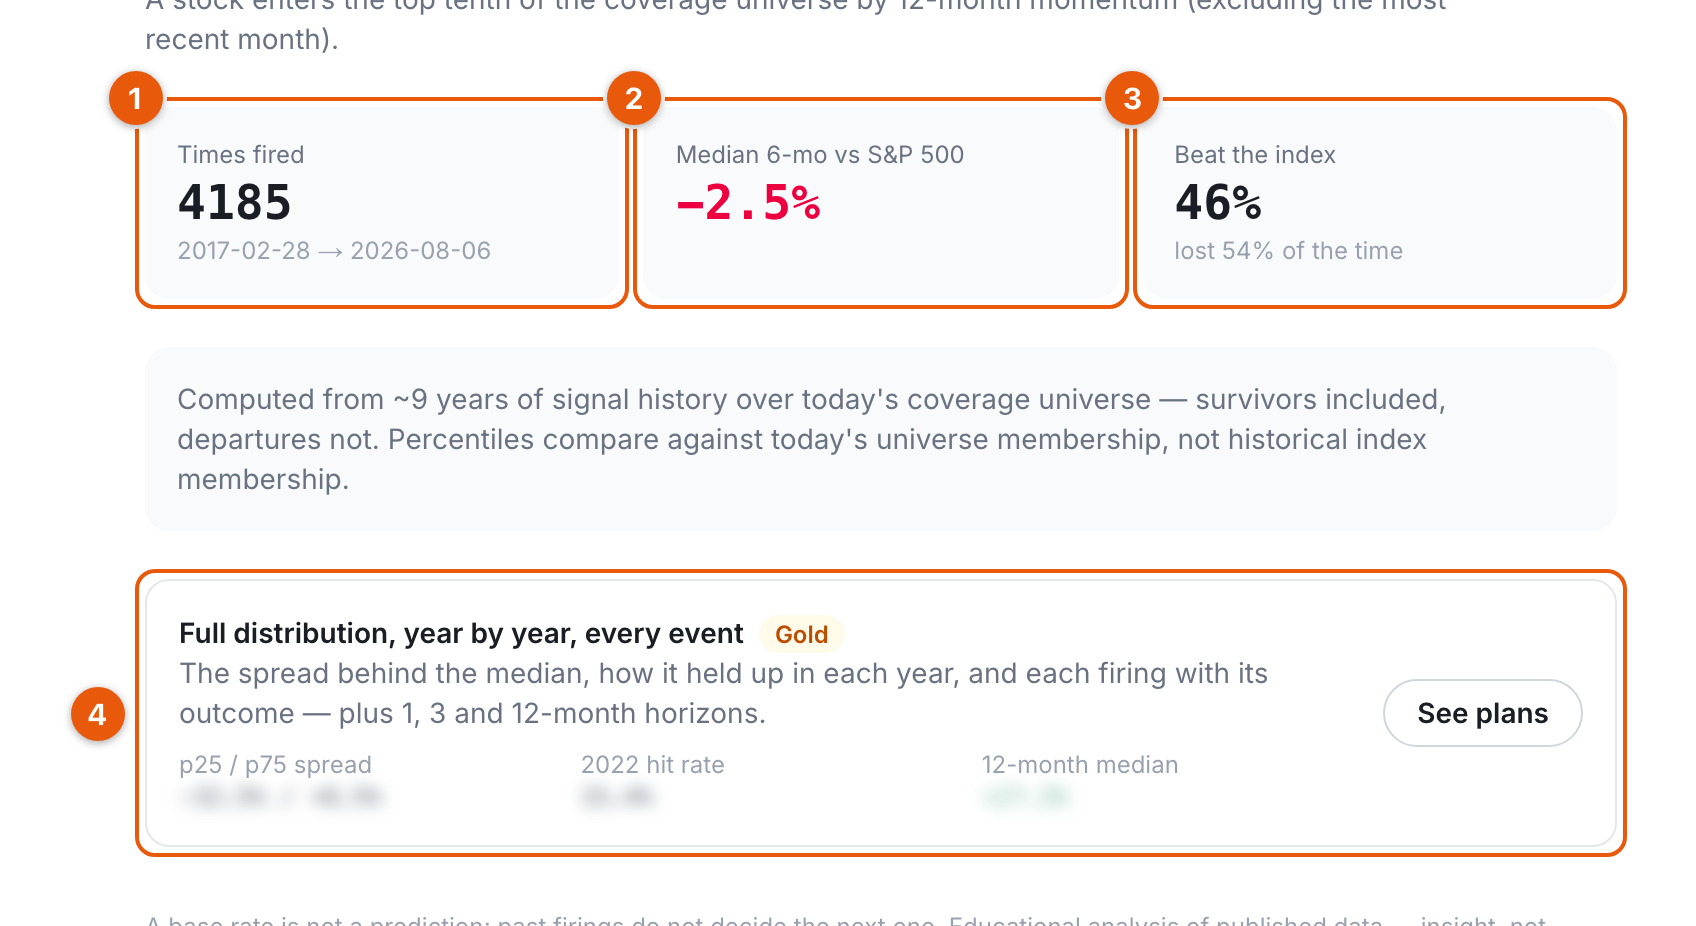
Under the cards sits the depth note: the history window, the survivorship caveat, and how events are dated. The gated card (4) lists what members see behind the median: the p25/p75 spread, each year separately, and every firing with its outcome.
Step 3: read the depth tables
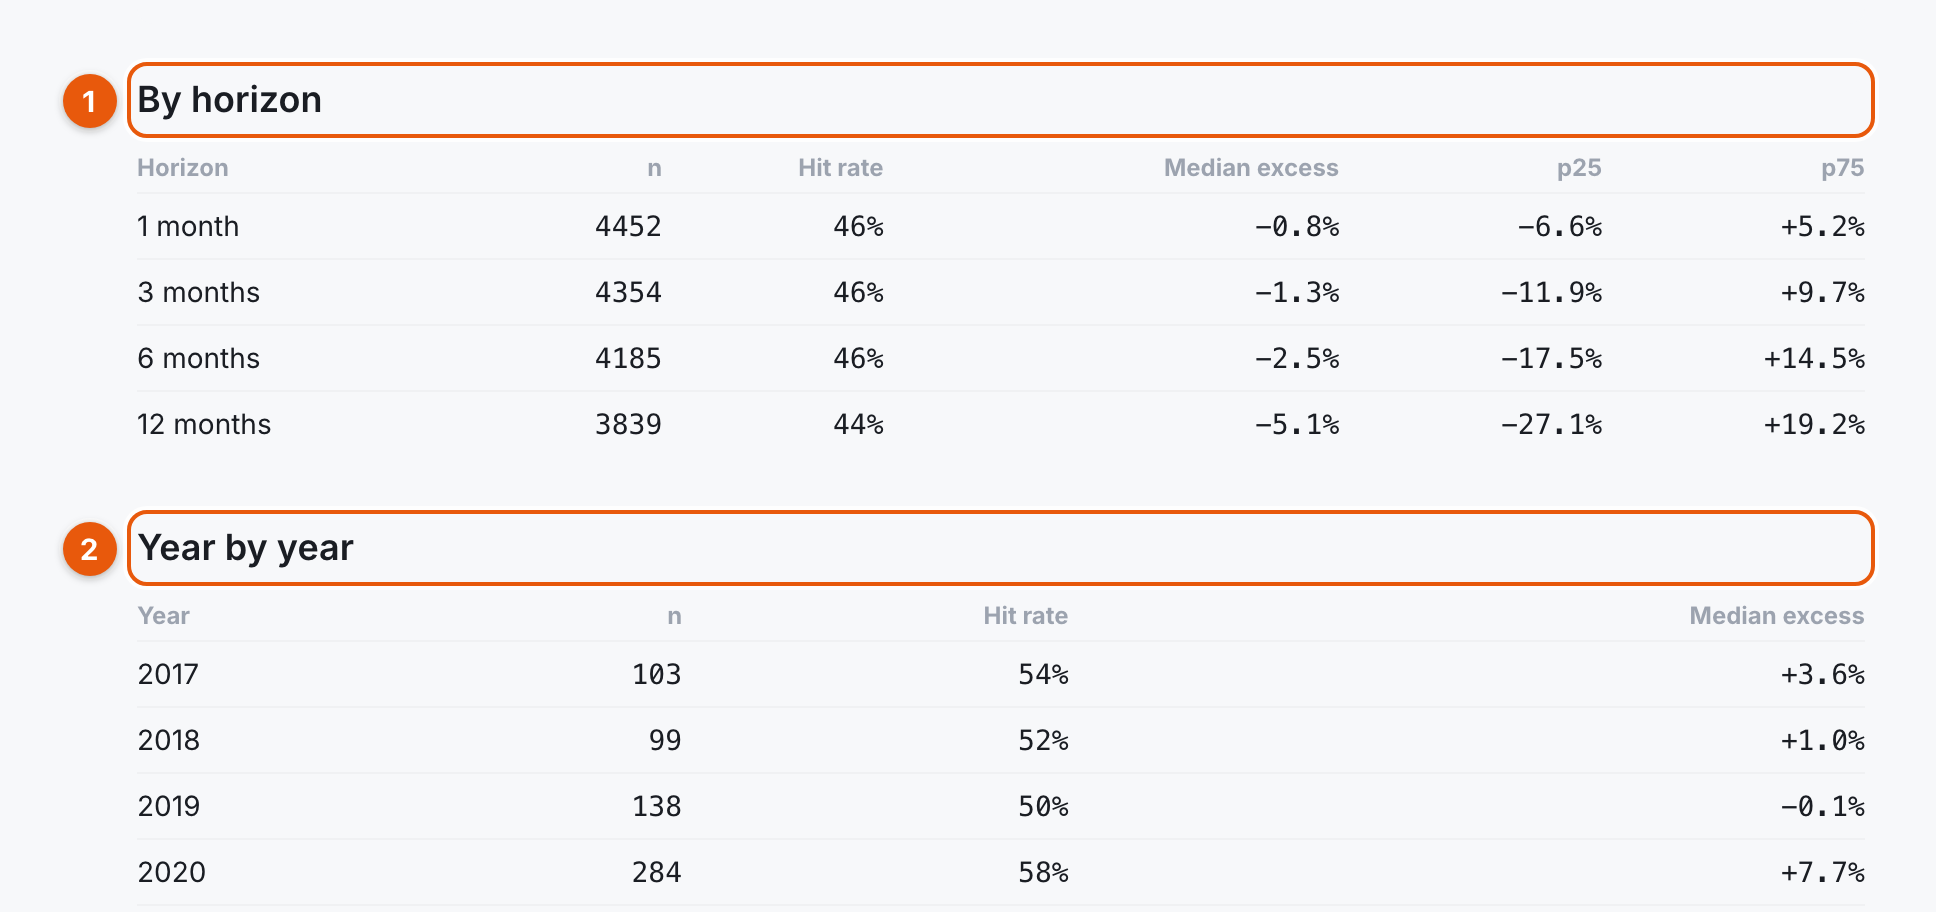
On a Gold plan, the same page under Research → Evidence adds the tables. By horizon (1) re-measures every event at one, three, six and twelve months, with the p25/p75 spread beside the median so you can see how wide the outcomes really are. Year by year (2) un-blends the all-history rate: a signal that hit 58% in 2020 and 44% in 2022 is a different object from one that hit 50% every year.
What these numbers do not mean
- Not a prediction. A 46% historical hit rate does not price the next event. It calibrates how much weight the signal deserves in your thinking.
- Not survivorship-free. Percentile signals rank against today's coverage universe measured backward. Companies that delisted along the way are not in the ranking. Every page says this in its depth note.
- Not always available. Below 30 closed events the page shows a count instead of a rate, because a percentage on a dozen events is decoration. Insider signals currently sit below the floor while stored filing history accrues from 2026.
- Not a recommendation. A signal firing on a stock you hold is information about a setup, not an instruction to trade it.
The habit this walkthrough builds: whenever a chart, a headline, or a screener claims a setup works, spend the ten minutes. Find the signal, read the three numbers, open the year-by-year table, and size your skepticism to what history actually shows. Educational analysis of published data. Insight, not advice.