Learn · walkthrough
Vet an ETF: Fees, Returns, Holders
Published · 6 min read
Funds do not file 10-Ks, so most stock research tooling goes quiet the moment you type an ETF symbol. Moneyta's ticker pages switch mode instead: for a fund, the page leads with the three things that actually decide long-run fund outcomes. What it costs, what it returned with dividends reinvested, and what it holds. This walkthrough uses VOO; any covered fund works the same way.
Step 1: open the fund's page
Go to moneyta.co/stocks/<symbol>, or search the symbol from Research as a member. The page detects that the ticker is a fund and renders the fund profile section.
Step 2: read the three blocks
The fees line (1) states the expense ratio, plus any front or back load. Where our fund universe is deep enough, this line also places the fee in context, in the form "higher than N% of the funds we track". The total return table (2) is the block that settles arguments: YTD, one, three and five-year total returns with dividends reinvested, each with the S&P 500 (SPY) beside it over the exact same window. The holdings line (3) reports how many constituents we have synced for the fund.
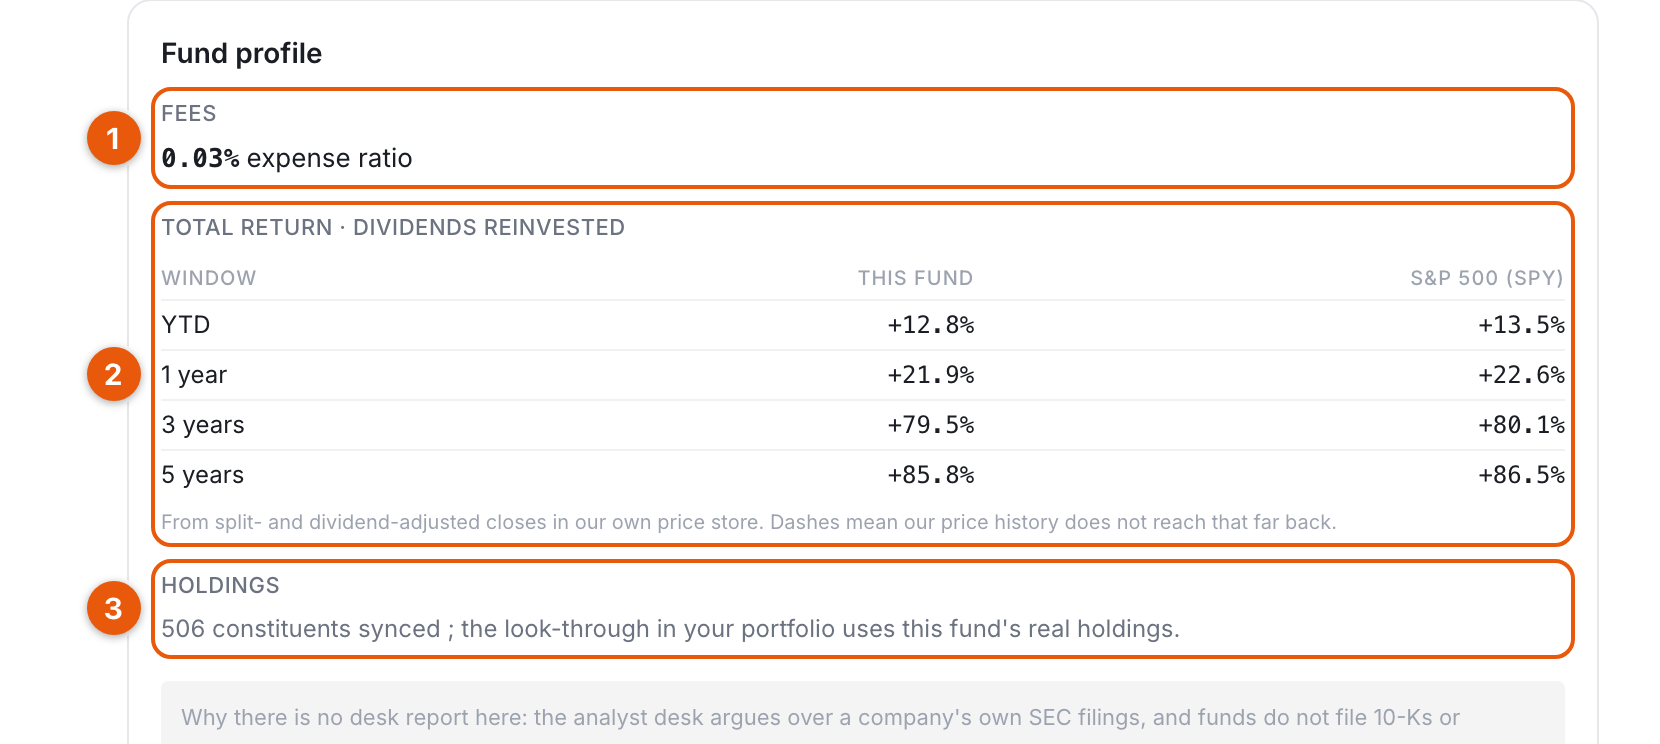
The sourcing footnote matters: returns come from split and dividend-adjusted closes in our own price store, and a dash means our history does not reach that far back. No vendor's glossy fact sheet is involved, which is why the numbers can be checked.
Step 3: check who holds it
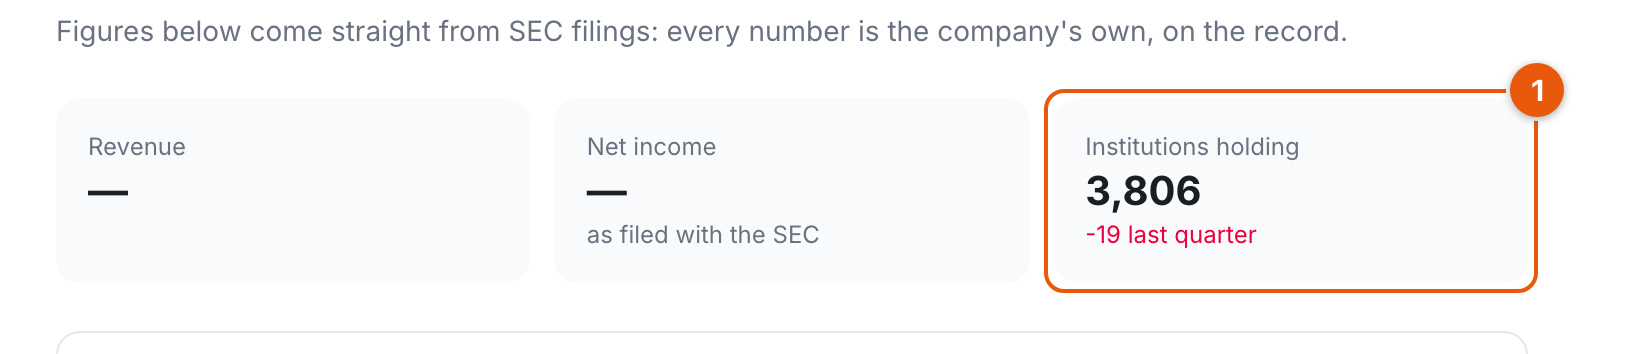
ETFs appear in the quarterly holdings reports large managers file with the SEC like any other security, so the institutional layer works for funds too. The institutions holding card (1) counts how many of the 500 largest managers reported the fund last quarter and the change from the quarter before. Note what the fund page honestly leaves blank: revenue and net income show dashes, because funds do not file income statements, and Moneyta does not fake a number where a filing does not exist.
Why there is no desk report for a fund
The analyst desk argues over a company's own SEC filings, and a fund has none, so the fund page says exactly that instead of generating filler. Price-derived signals still apply, and the evidence pages cover them. If you hold overlapping funds, the member look-through goes one level deeper: it pierces each ETF into its constituents and adds every slice to your direct positions, which is how you discover you own more of your favorite stock than you think.
The five-minute fund checklist
- Expense ratio, and how it compares where context exists.
- Total return beside SPY over one, three and five years, with dividends reinvested on both sides.
- Constituent coverage, and what the look-through can see.
- Institutional holder count and its direction.
A fund that costs more than an index fund and returns less than one over every matched window has answered your question. Educational analysis of published data. Insight, not advice.