
One Journal for Every Dollar: Inside the Activity Feed
Dividends live in broker statements, house costs in a spreadsheet, car repairs nowhere at all. The Activity feed is one running journal of every money event across everything you own, and most of it writes itself.
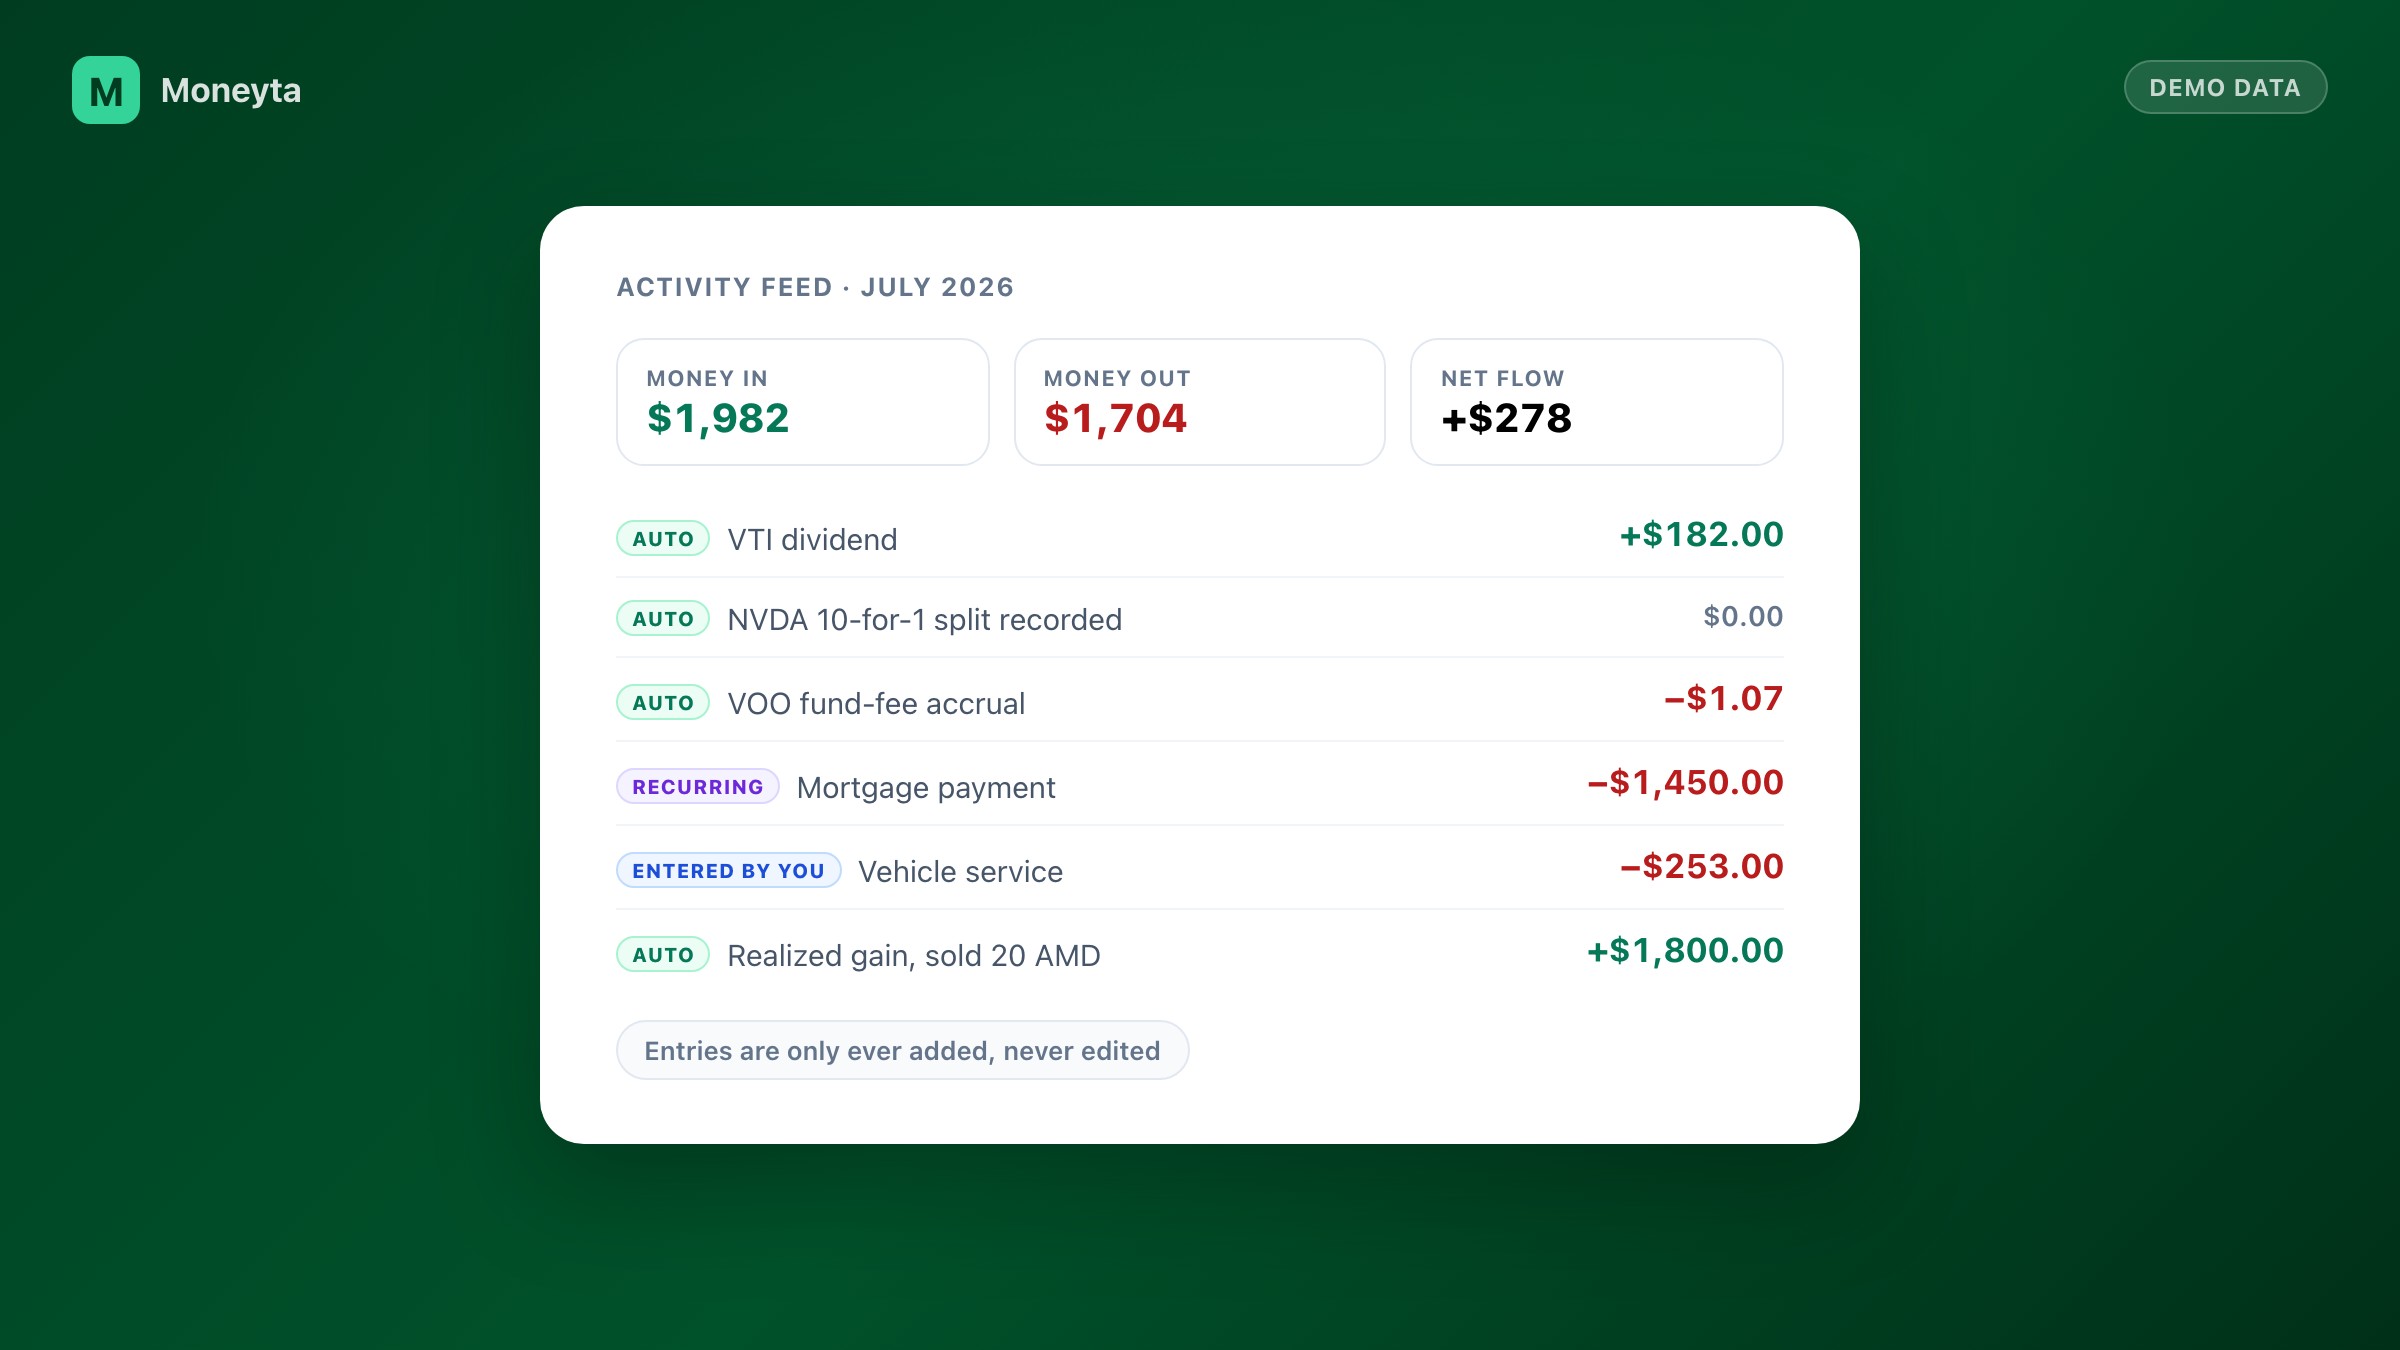
Quick quiz: how much dividend income did you collect last month? What did the house cost you? What did your funds quietly charge? For most people those three answers live in three different places, a broker statement, a spreadsheet, and nowhere. The Activity feed is our answer: one running journal, newest first, of every money event across your portfolio, real estate, vehicles and valuables.
Most of it writes itself
The reason financial journals fail is that humans have to keep them. So we made the feed mostly automatic. Entries tagged Auto post themselves from your portfolio and daily market data: dividends your holdings pay, gains and losses when you sell, company events like stock splits, and the fees your funds charge. Entries tagged Recurring post on their due date, like the mortgage payment derived from the mortgage you added. The only entries you type are the ones only you know about: the property tax bill, the car service, the appraisal fee. Pick a category, enter the amount, done.
Every computed number shows its work
The feed's quietest superpower is that calculated figures don't ask for your trust. That $1.07 fund-fee accrual comes with its math: the fund's expense ratio, times your average balance, times the slice of the year. If something ever looks off, you can flag it in one tap. We think show-your-work should be table stakes for anything that computes numbers about your money.

A history that never flinches
Entries are only ever added, never edited or deleted. Fix a mistake and the correction posts as its own entry, right there in the timeline. That sounds strict until the first time you actually need your history: a tax question, an insurance claim, a simple 'wait, when did that happen?'. A record that can't be quietly rewritten is a record you can actually lean on. (One privacy note: expenses you log against a Vault valuable appear in the feed, but the encrypted values of the items themselves never do.)
The month, at a glance
Three cards summarize any period: money in, money out, and net flow. Filter by asset type or time, export the whole thing to CSV for your records or your accountant, or roll it up into the year-end report. Income shows green, expenses show red, and for the first time the whole picture is one scroll instead of five tabs.
- Dividends, sale gains, fund fees and splits post automatically. Scheduled payments post on their due date. You only log what only you know.
- Calculated entries carry their math. Flag anything that looks off in one tap.
- The journal is append-only: corrections join the record instead of replacing it.
- Money in, money out, net flow, for any month, any asset class, exportable.
See a month of your money in one place
Start freeEvery new account starts with 14 days of Gold: every feature on, no card. Then Free, unless you choose a plan.