What Did Your Money Actually Do This Year?
Most investors can quote their portfolio's value but not what it earned or cost them this year. The income and expense report answers that in one page: totals, categories, and the IRS form each item maps to.

Ask an investor what their portfolio is worth and you'll get a number to the dollar. Ask what their money actually did this year, what it earned in dividends, what the rental really cost, what the funds quietly charged, and the confidence disappears. Value is a snapshot. What your money did is a story, and most tools never tell it.
Both sides of the year, added up
The income and expense report totals the year from your own activity: on one side, the money your assets earned, dividends and realized gains; on the other, what they cost, property tax and insurance and upkeep, vehicle running costs, valuables expenses, and fund fees. The demo report above tells a story a surprising number of households would recognize: the portfolio earned about $4,100 while the physical assets cost about $6,300 to carry. Neither number is good or bad on its own. The point is that you know them.
Grouped the way your accountant thinks
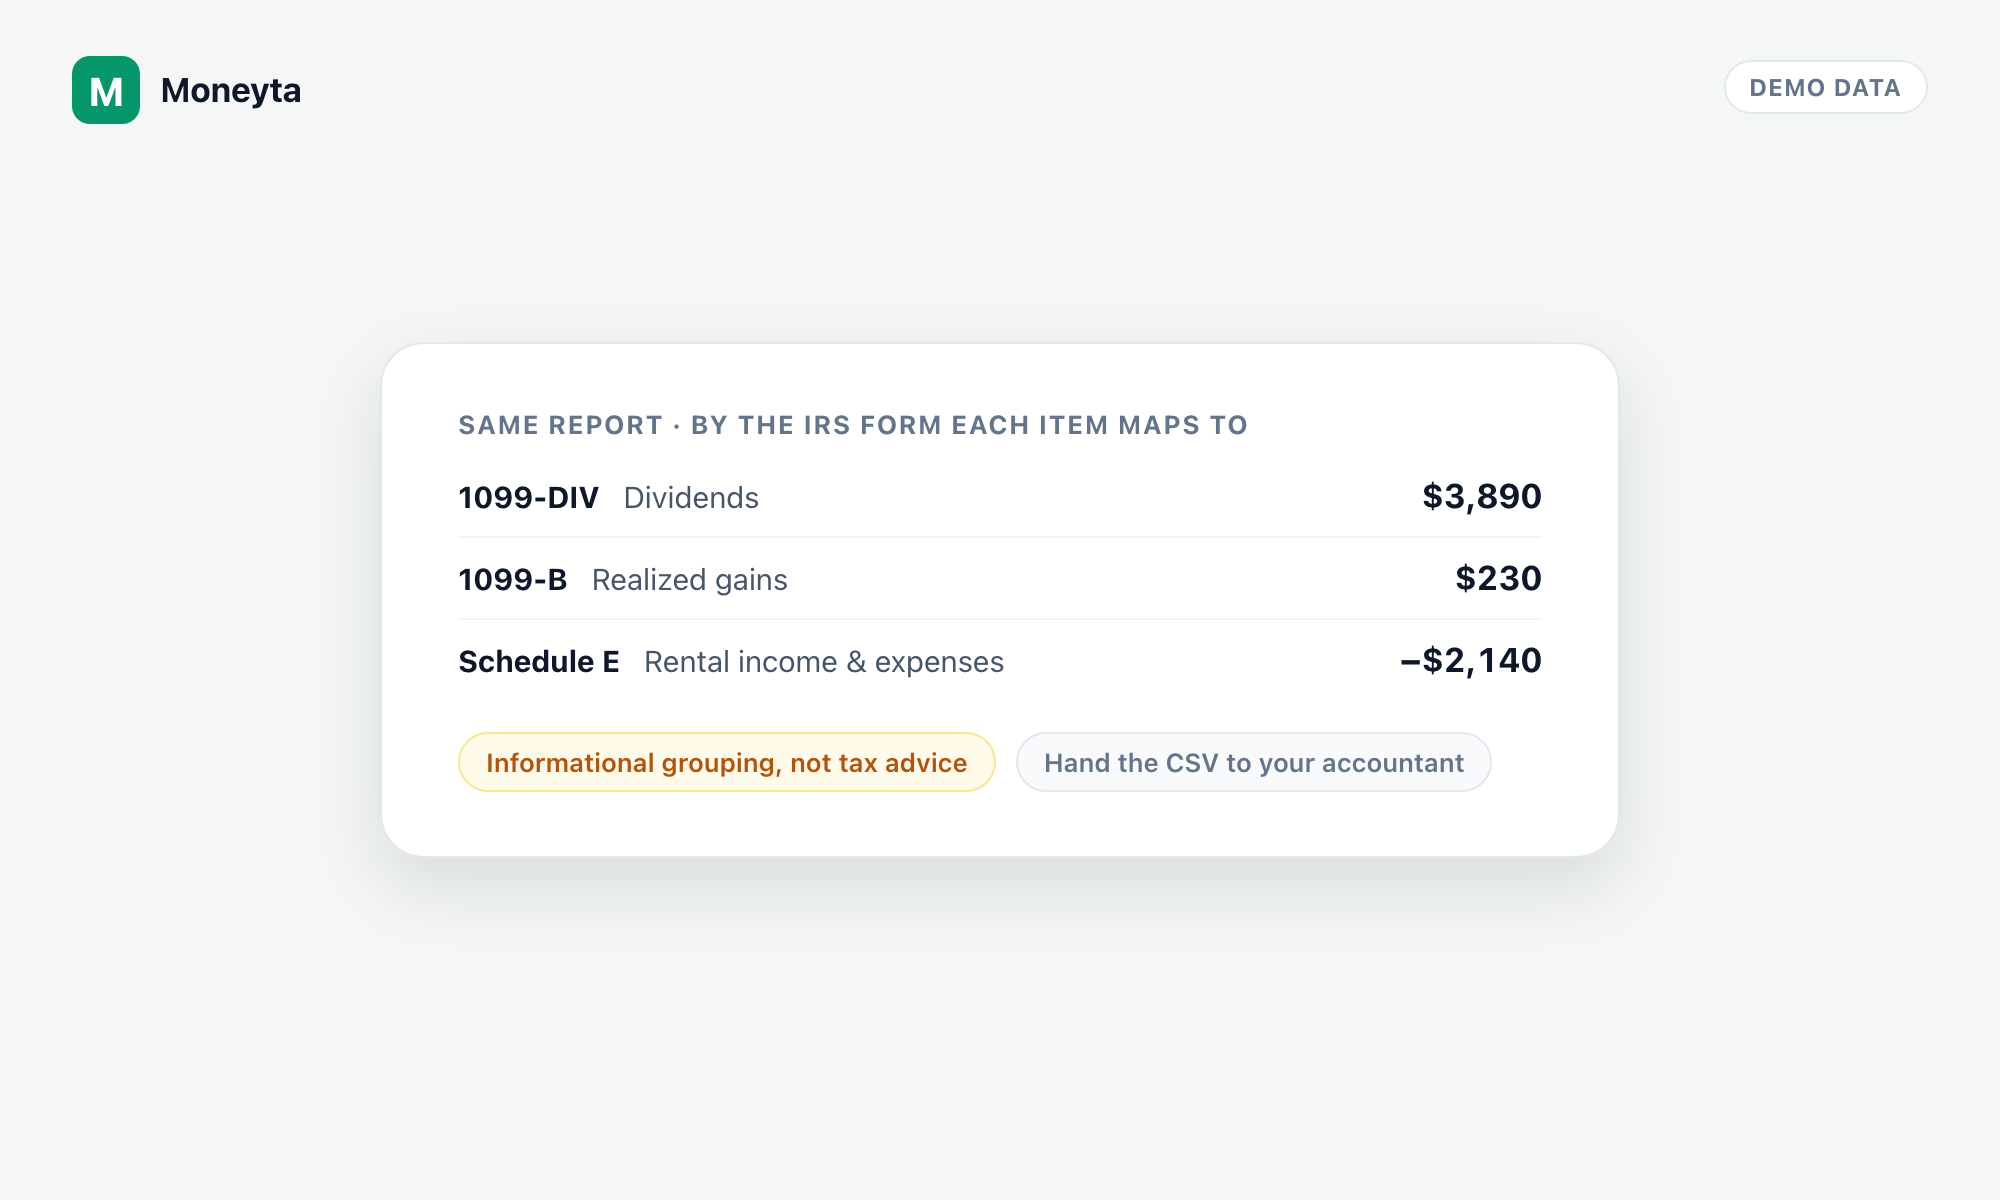
Come tax season, the same report regroups itself by the IRS form each item maps to: dividends under 1099-DIV, realized gains under 1099-B, rental income and expenses under Schedule E. That's an informational grouping, not tax preparation, but it turns the January scramble into a five-minute review, and the whole thing exports to CSV so your accountant gets a clean file instead of a shoebox.
Where the numbers come from
The report isn't a form you fill in. It's generated from your Activity feed, the running journal where dividends, sale gains, fund fees and the expenses you log all land as they happen. Keep the journal (mostly, it keeps itself) and the year-end report is simply true. That's the quiet payoff of real books: the reports stop being a project.
- Know both sides: what your assets earned and what they cost to carry, by category, for any year.
- The tax view groups the same numbers by IRS form, so January starts organized instead of archaeological.
- Everything flows from the Activity feed automatically. No year-end reconstruction.
- CSV export hands your accountant a clean file.
See what your money did this year
Start your 7-day free trial