
You Own More of Your Favorite Stock Than You Think
We each held an index fund for diversification and a favorite stock on the side, and never added the two together. Moneyta's look-through pierces every ETF to show your true exposure to a name: the shares you hold directly plus every slice hiding inside your funds.

We built Moneyta because we kept getting surprised by our own portfolios, and this is the surprise that started it. Between us we each held a broad S&P 500 index fund, because that's the standard advice for staying diversified. We also held a few individual names we liked. What none of us had done was add those two things together, and it turned out our real exposure to our favorite stock was quite a bit bigger than any single line on the statement showed.
An ETF is a basket, and your stock is probably inside it
Your statement lists the index fund on one line and, say, Nvidia on another, as if they have nothing to do with each other. They do. That S&P 500 fund already holds Nvidia, Apple, Microsoft, and 497 other companies. So your true exposure to any one of them is the shares you hold directly plus the slice of it sitting inside every fund that holds it. Look-through is the part of Moneyta that pierces each ETF into its actual constituents and adds all of that up for you.
Here's our demo portfolio, pierced. On the surface Nvidia looks like a big-but-ordinary position. Once you count the shares hiding inside the two index funds it also sits in, its real weight climbs to 31%.
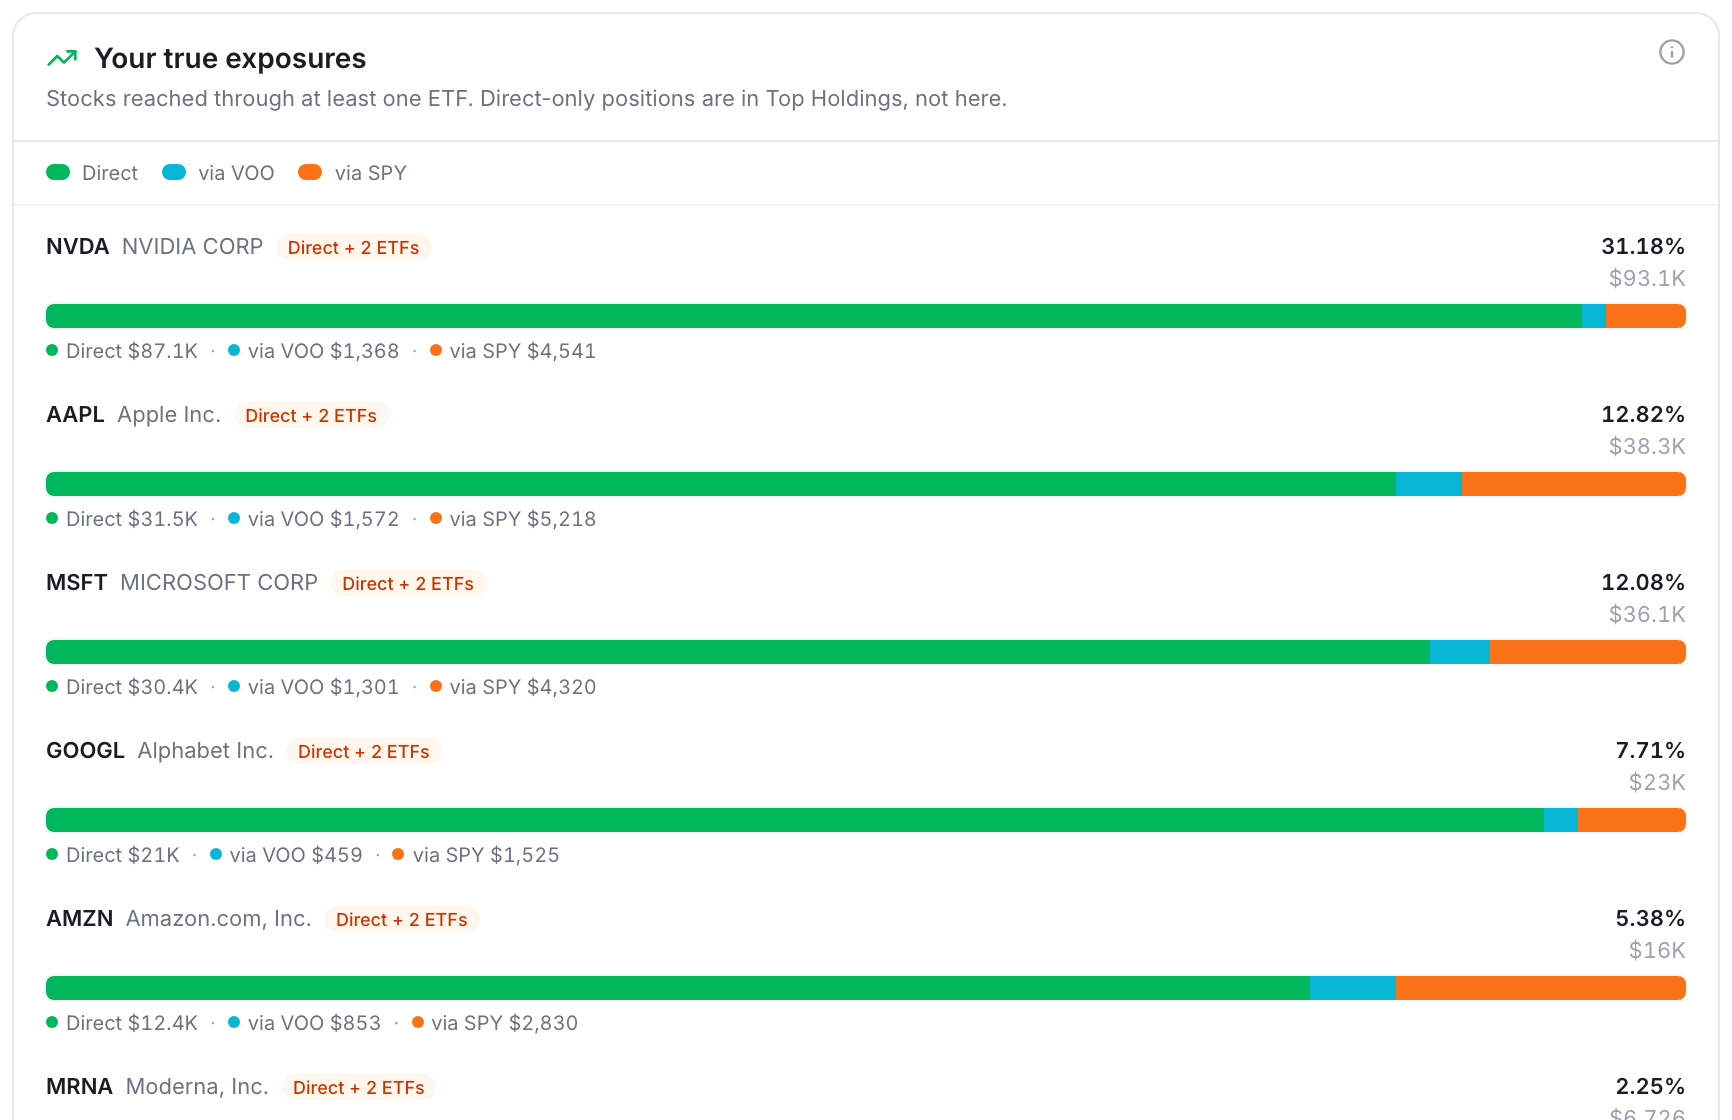
The gap is small in this example, a couple of points, but that's the point: it was invisible until something added it up, and it only ever grows as you buy more funds. On a bigger, fund-heavy portfolio the difference between what you think you own and what you actually own can be enormous.
The same names, hiding across your funds
Look-through catches repetition too. Buy an S&P 500 fund from one provider and another from a second, and it feels like you spread your money across two funds. You didn't. They hold the same 500 companies, so a second S&P 500 fund is a duplicate, not a diversifier, and you're paying two expense ratios for one bet.

What we do about it now
- Read your exposure through the funds, not just the direct line. Your real weight in a name is direct shares plus every ETF slice of it.
- Treat two funds that track the same index as one position. A second S&P 500 fund is a duplicate, not a diversifier.
- Decide the overlap on purpose. Concentrated conviction is fine, as long as you chose it instead of drifting into it without noticing.
See what's really inside your ETFs
Start free