Learn · walkthrough
Size Up a Ticker in Five Minutes
Published · 7 min read
Someone mentions a ticker. Before you form an opinion, you want the basics: how big is it, what does it earn, what does the market pay for those earnings, and who owns it. Moneyta's ticker pages answer that in one screen, and every number tells you where it came from. This walkthrough uses NVDA; substitute any symbol.
Step 1: open the ticker page
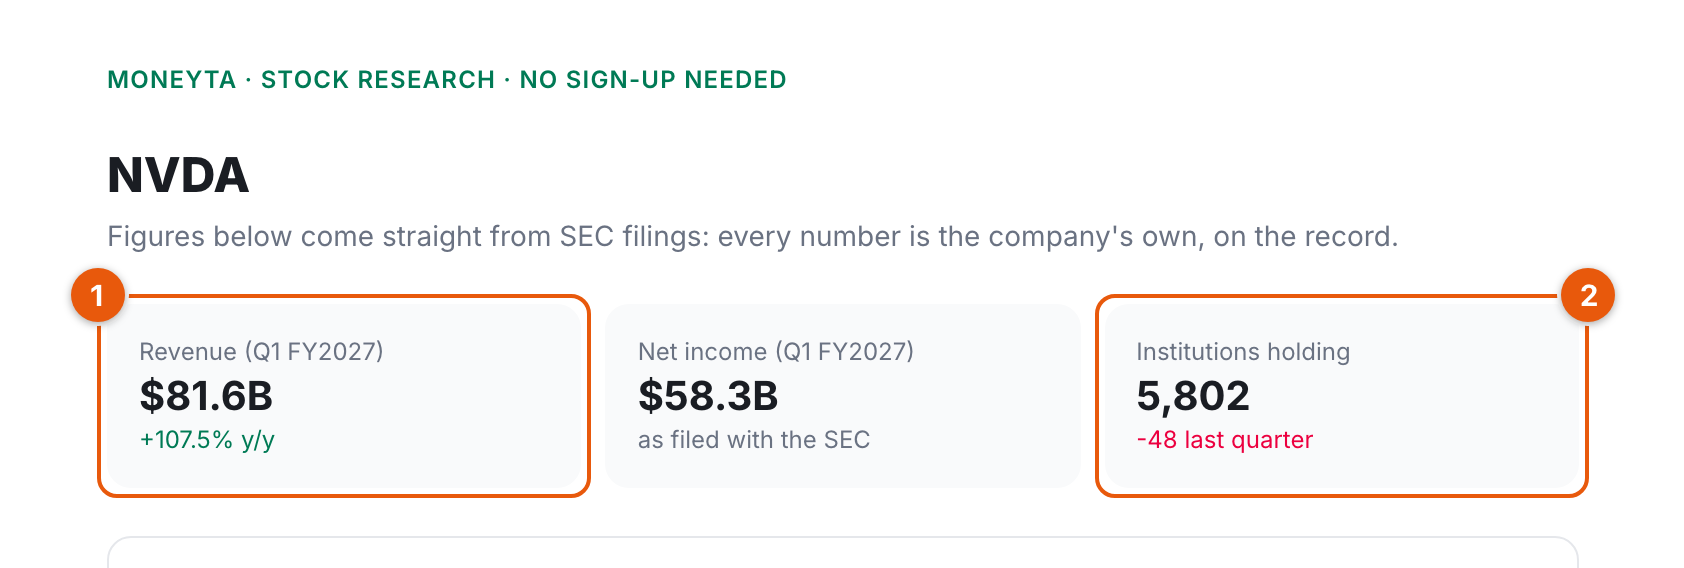
Public ticker pages live at moneyta.co/stocks/<symbol>, no account needed. Members get the fuller workstation by opening Research and typing the symbol into the search box. On the public page, the first row of cards is fundamentals straight from SEC filings: revenue with its year-over-year change (1), net income as filed, and how many of the 500 largest managers held the stock at the latest quarter (2), with the change from the quarter before.
Step 2: read the quote strip
Below the fundamentals sits the quote strip: eleven market stats on one card. Ranges come from our nightly price store; the 52-week range (1) places today's price inside the year's extremes. Market cap (2) is shares outstanding from the company's own SEC facts multiplied by the last close. P/E (3) divides that price by earnings summed from the last four filed quarters, so it is a trailing number a filing can defend.
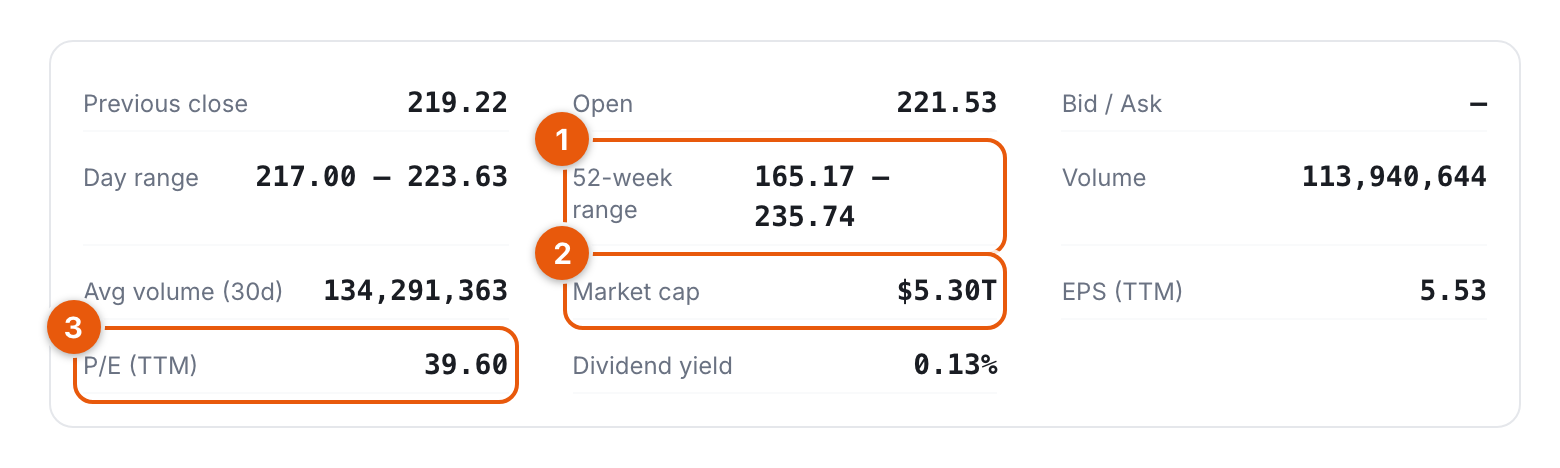
Two details are worth noticing. A dash is an answer: bid/ask shows one off-hours, because a stale quote dressed up as live data would be a small lie. And when bid/ask does populate, the footnote names the venue and timestamp, because a single venue's top of book is not the consolidated market.
Step 3: the member workstation
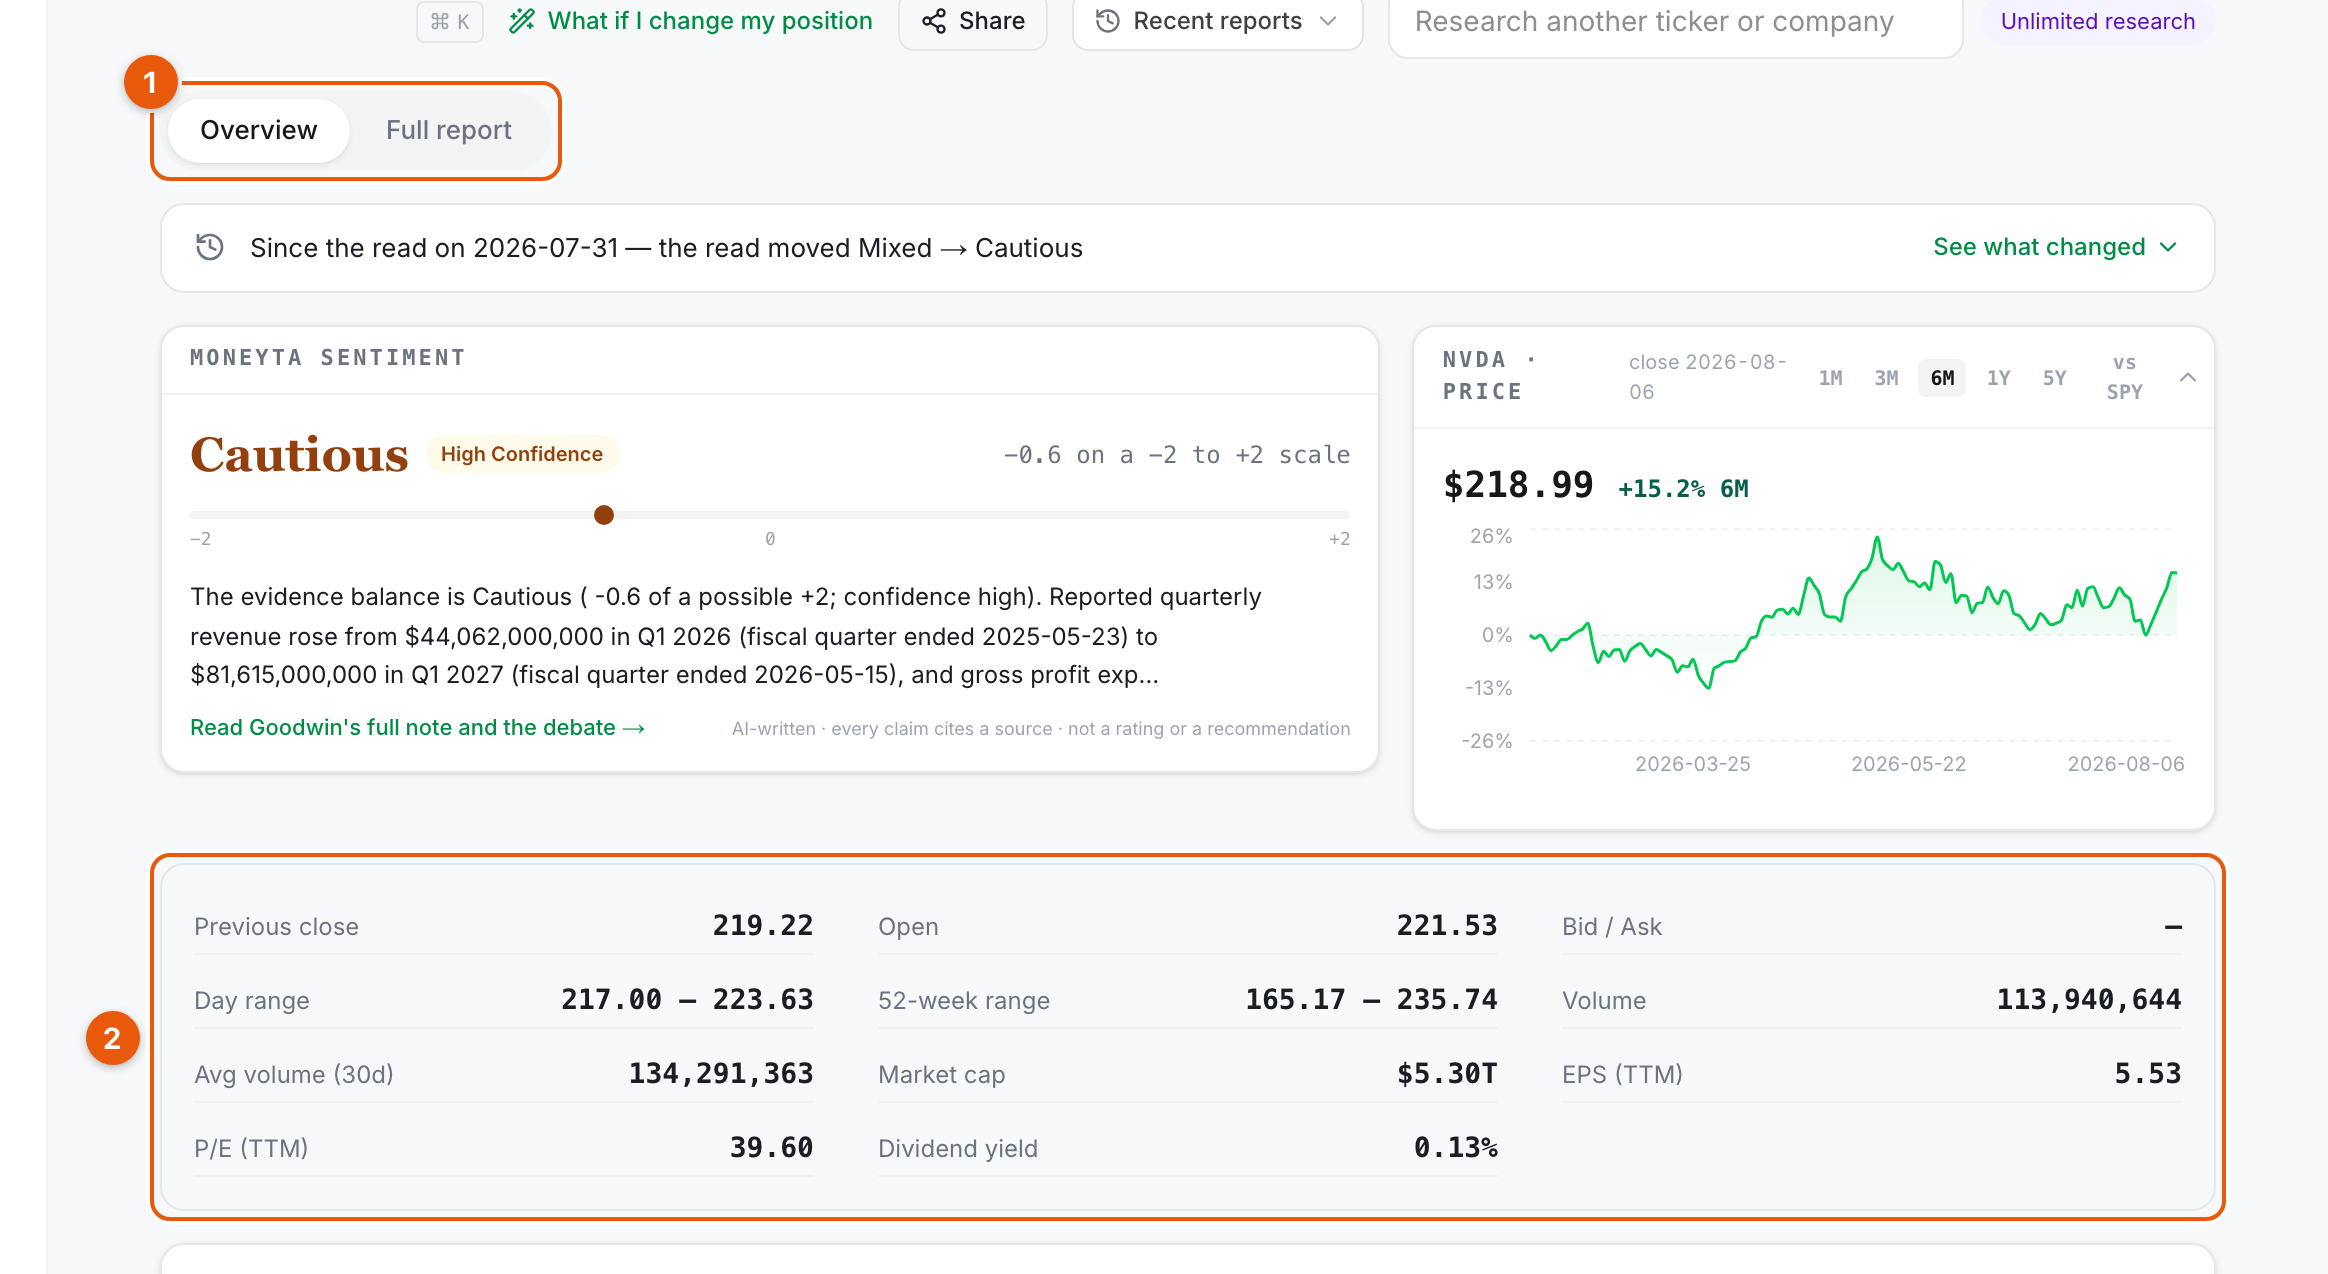
Members see the same ticker as a two-view workstation (1): Overview for orientation, Full report for the desk's evidence-cited note. Overview stacks the sentiment card, the price chart with an SPY comparison, and the live quote strip (2), then the dock of deeper tabs: news, filings, ownership, insiders, institutions.
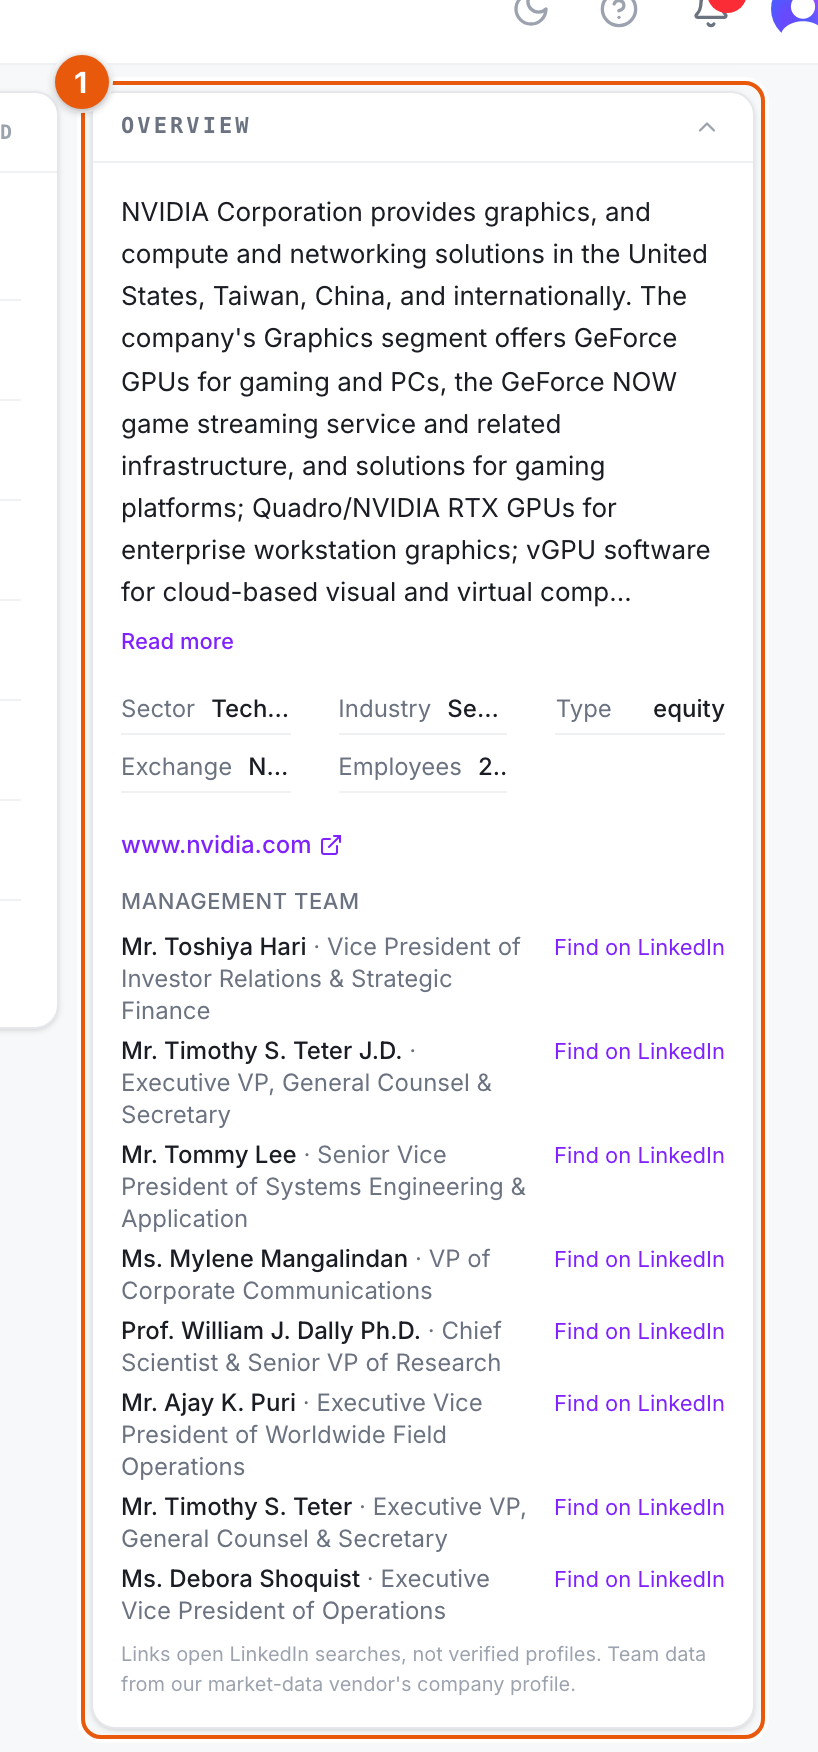
The right rail carries the overview card (1): what the company does, sector, industry, exchange, employees, and the management team with LinkedIn search links. The card is honest about its seams: the links open searches, not verified profiles, and team data comes from our market-data vendor's company profile.
The five-minute checklist
- Revenue and net income, as filed, with the growth direction.
- Market cap and trailing P/E, computed from filings and closes.
- Where price sits in the 52-week range, and on what volume.
- Institutional holder count and its quarterly direction.
- What the company actually does, from the overview card.
Five minutes gets you calibrated, not convinced. If the ticker still interests you, the dock's Insiders and Institutions tabs and the full desk report are the next layer. Educational analysis of published data. Insight, not advice.