
AI Bubble Burst or Reality Check? The Tech Rout Was Narrow. Was Your Portfolio?
Is the AI bubble bursting, or is this a reality check? The October 2026 tech selloff wiped about five trillion dollars off Nvidia, Alphabet and the other big AI and chip stocks while most of the market went up. Whether you felt the Nasdaq correction came down to two portfolio risk numbers on your Moneyta dashboard: how much of your portfolio is technology, and how hard it moves when the market moves. Here is how to read them before the next week like this one.
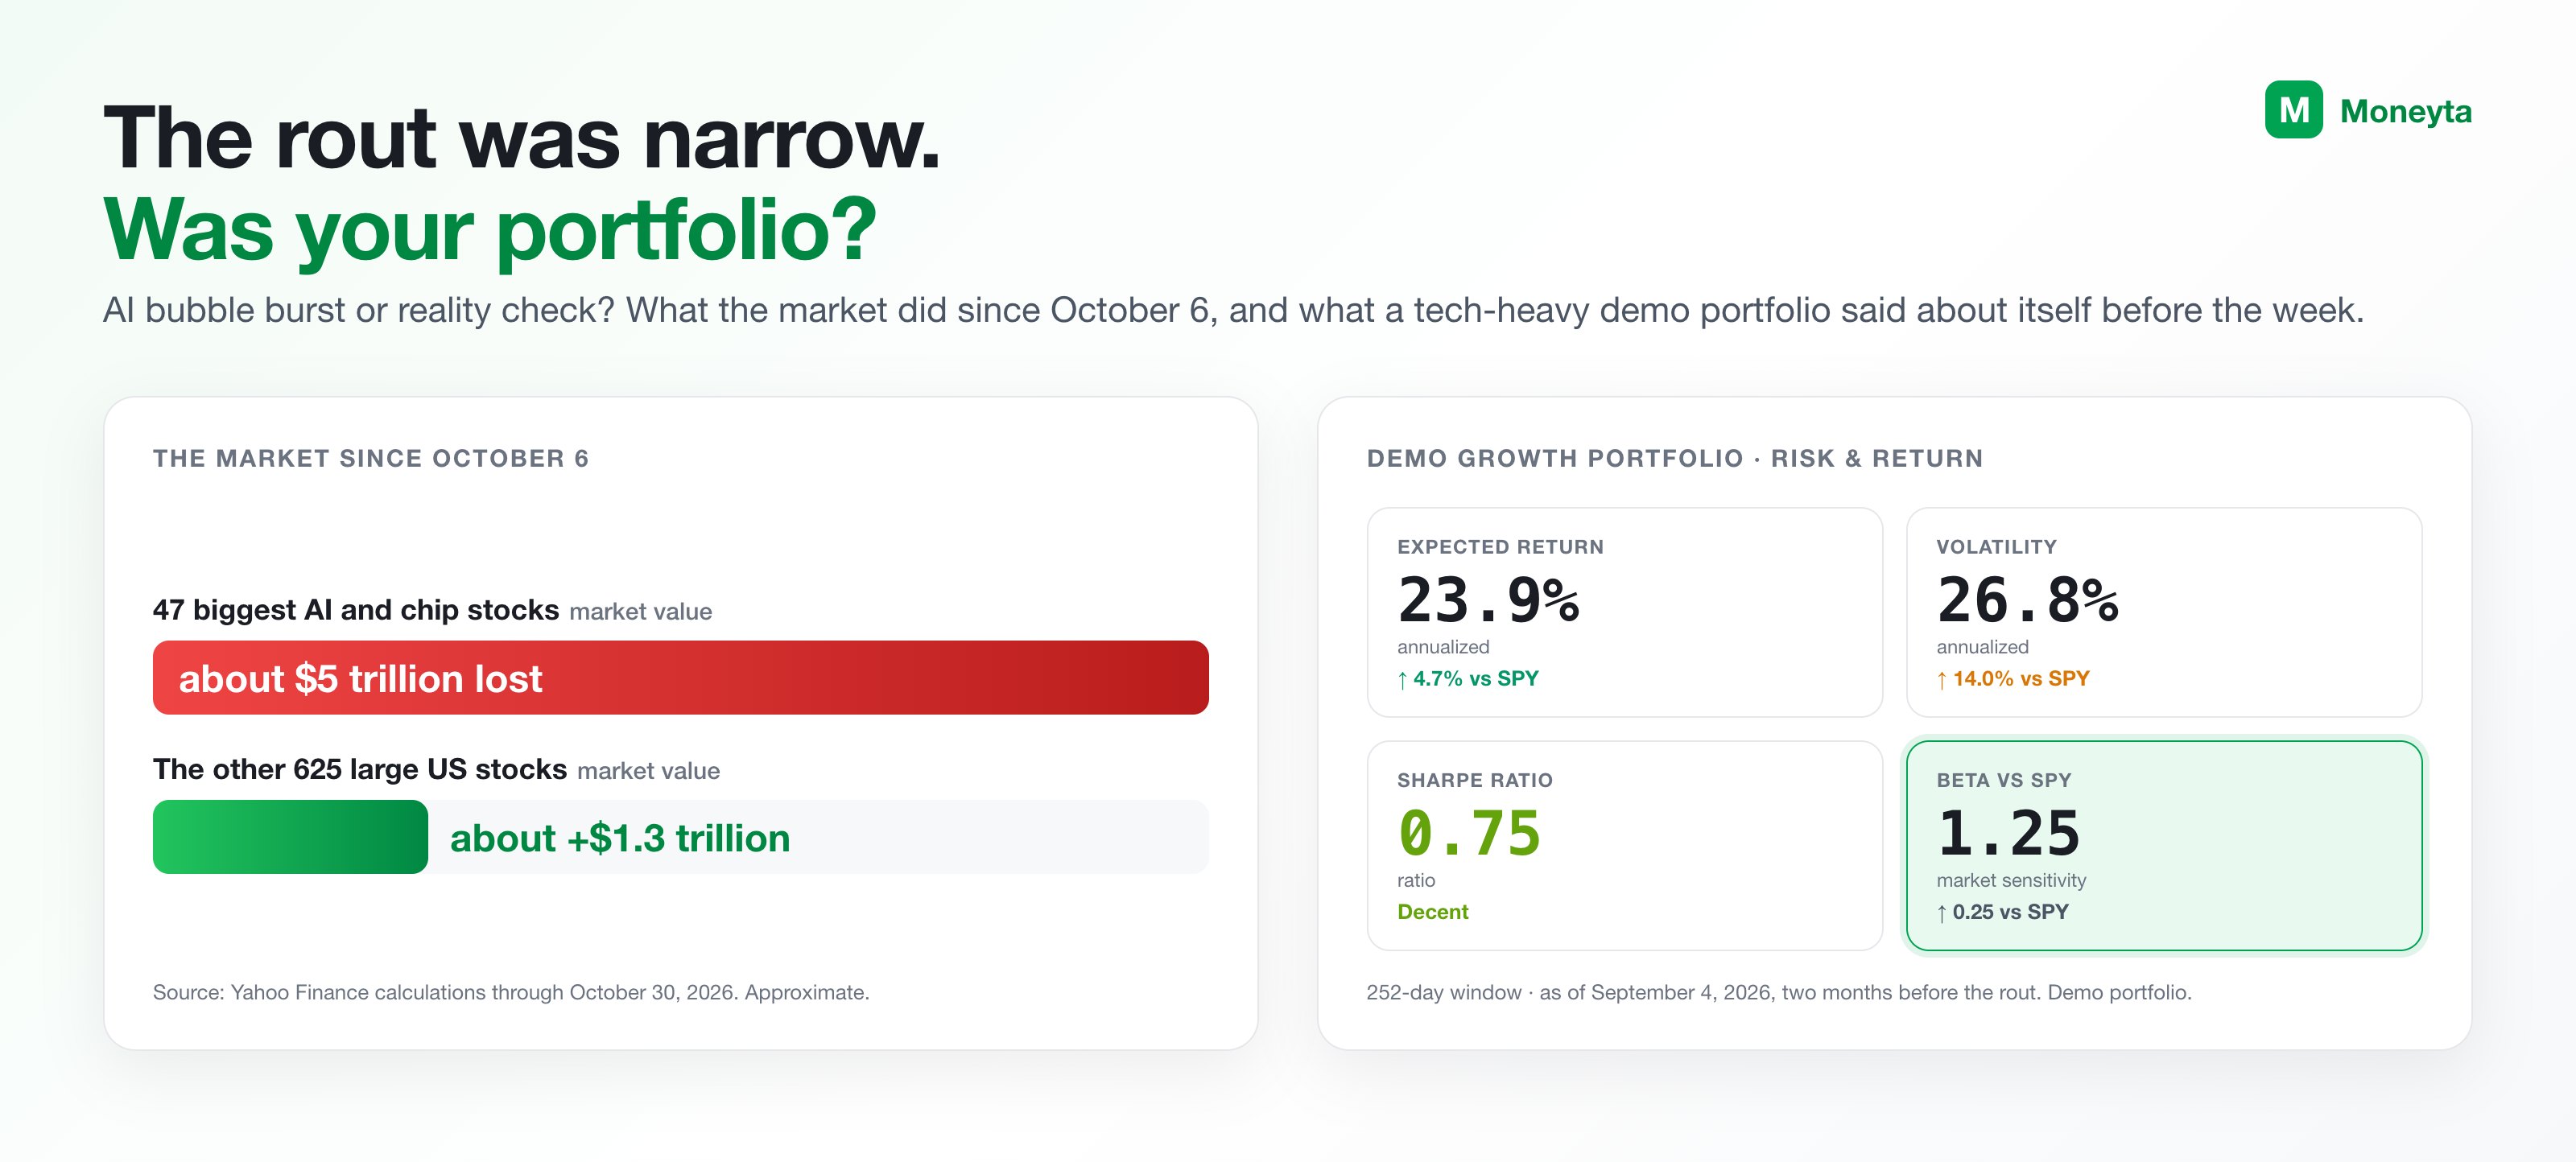
AI bubble burst or reality check? What actually happened
First, what actually happened, because the headline number hides the shape of it. By Yahoo Finance's count, the 47 biggest AI and chip stocks lost about five trillion dollars of market value between October 6 and October 30, with Nvidia and Alphabet each giving up roughly 834 billion dollars. The final week was the worst of it. Alphabet fell about 12 percent in a day after its results, its biggest drop since it listed in 2004, according to CNBC. Intel lost close to 29 percent in a session after weak guidance, and the Nasdaq 100 fell 3.5 percent on Friday October 30 alone, its deepest one-day slide since June and the cap on a third straight losing week, as Bloomberg reported. The Nasdaq Composite closed October down about 5 percent, its worst month since March.
Now the part that matters for this post. Over that same stretch, the other 625 large US stocks in Yahoo Finance's tally added about 1.3 trillion dollars. In the final week the S&P 500 slipped only about 0.6 percent, and nine of its eleven sectors rose by one percent or more. Yahoo Finance notes that no other down week since at least 1999 had that many sectors rise that much. This was not a stock market crash, and it was not the Magnificent Seven as a group: Apple ended the week as the most valuable company in the world. It was a narrow, violent repricing of one trade: the bet that enormous AI capital spending will pay for itself, after Alphabet held its 2026 spending plan near 200 billion dollars and said 2027 would be higher still, and Amazon kept its own plan near 220 billion.
So, AI bubble burst or reality check? Honestly, nobody knows yet, and we are not going to pretend a dashboard does. Capital Economics has said it expects an AI bubble to burst next year, as CBS News reported. Other strategists call October a healthy correction inside an intact AI trade. Both camps will be loud for months. What we can say is that the question that matters for you is a different one, and it has an answer today.
Why a narrow tech selloff surprises more investors than a crash
A broad crash hits everyone, and everyone half expects it. A narrow rout hits people in proportion to one thing: how much of what they own sits inside the trade that broke. The investor holding a plain index fund had a mildly down week and nine sectors quietly working in their favor. The investor whose portfolio was half technology, with nearly 30 percent of it in one chip maker, had a very different week. The difference between those two weeks was decided before the week began, and it was visible before the week began.
This is the thing professionals do that most individual investors never get to do. Before the headline, they know their exposure. They know what share of the book sits in one sector, which positions move together, and how hard the whole thing swings when the market swings, because a risk report tells them every morning. We built Moneyta so that you can see the same thing on a dashboard, instead of learning it from a brokerage statement after the fact.
What Goodwin had already said
Goodwin is the narrator on your Moneyta dashboard. Every analysis runs a fixed set of checks on your holdings and turns the ones that matter into observations, ranked by how much they matter. The screenshots below are from a demo portfolio on a development build of Moneyta, analyzed in early September, two months before the rout. These are the observations it carried at the top, every time you looked:
- High technology concentration. It fires when technology passes 40 percent of your portfolio, and it names the number. The description carries a plain note that the sector is sensitive to interest-rate changes, which is a polite way of saying it tends to fall faster than it rises when the mood turns.
- High concentration in single position. More than 20 percent in one name is a warning. More than 40 percent is critical. A portfolio with close to 30 percent of its value in one chip maker heard about it at every analysis.
- Hidden risk: positions that move together. Above the Risk & Return card, a band counts the pairs of holdings whose prices move in lockstep. Five chip and cloud names that each felt like a separate decision when you bought them are, in a week like this one, a single decision.
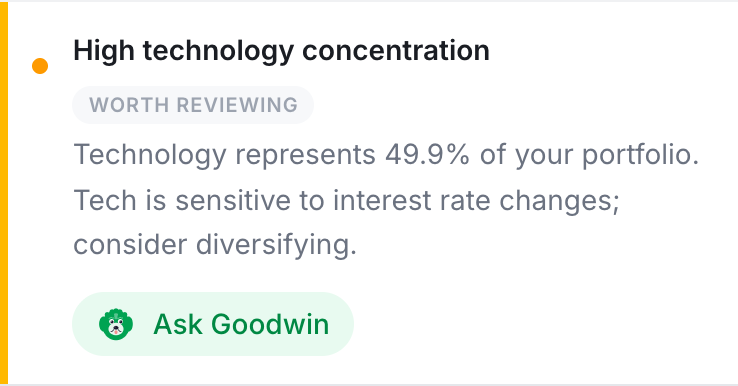
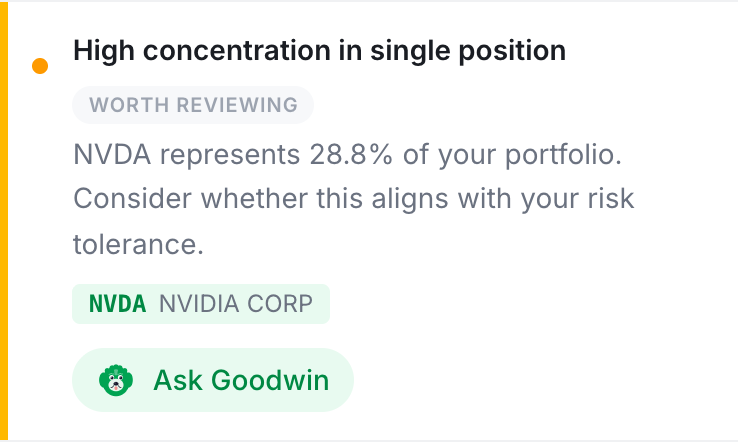
None of these say sell. Moneyta is not an advisor and the observations are exactly that, observations: here is what your portfolio looks like, here is the number, here is why it is worth knowing. Press Ask Goodwin and it explains the observation in plain English against your own holdings, what the number means and what it tends to do in weeks like the one we just had. What you do about it is yours.
See how concentrated your own portfolio is, in about a minute.
Start freeRisk & Return: the four portfolio risk numbers that say what to expect
Below the observations sits a card called Risk & Return. It has four tiles, each computed from the stored daily closes of your actual holdings over the last 252 trading days, which is one year, and each compared with the S&P 500 through SPY:
- Expected Return: the average annual return the portfolio has produced over the window, projected forward at the same rate. Past performance, projected, and labelled as such.
- Volatility: how much the portfolio's value typically moves around its average, scaled to a year. The S&P 500 lives around 15 to 20 percent. A tech-heavy portfolio runs well above that, and the tile says by how much.
- Sharpe Ratio: return per unit of risk, measured against the three-month Treasury bill. Above 1.0 is strong, 0.5 to 1.0 is decent, below zero means the portfolio did not beat cash.
- Beta vs SPY: how much the portfolio moves when the market moves. 1.0 is one-for-one. 1.4 means a one percent market day is typically a 1.4 percent day for you, in both directions.
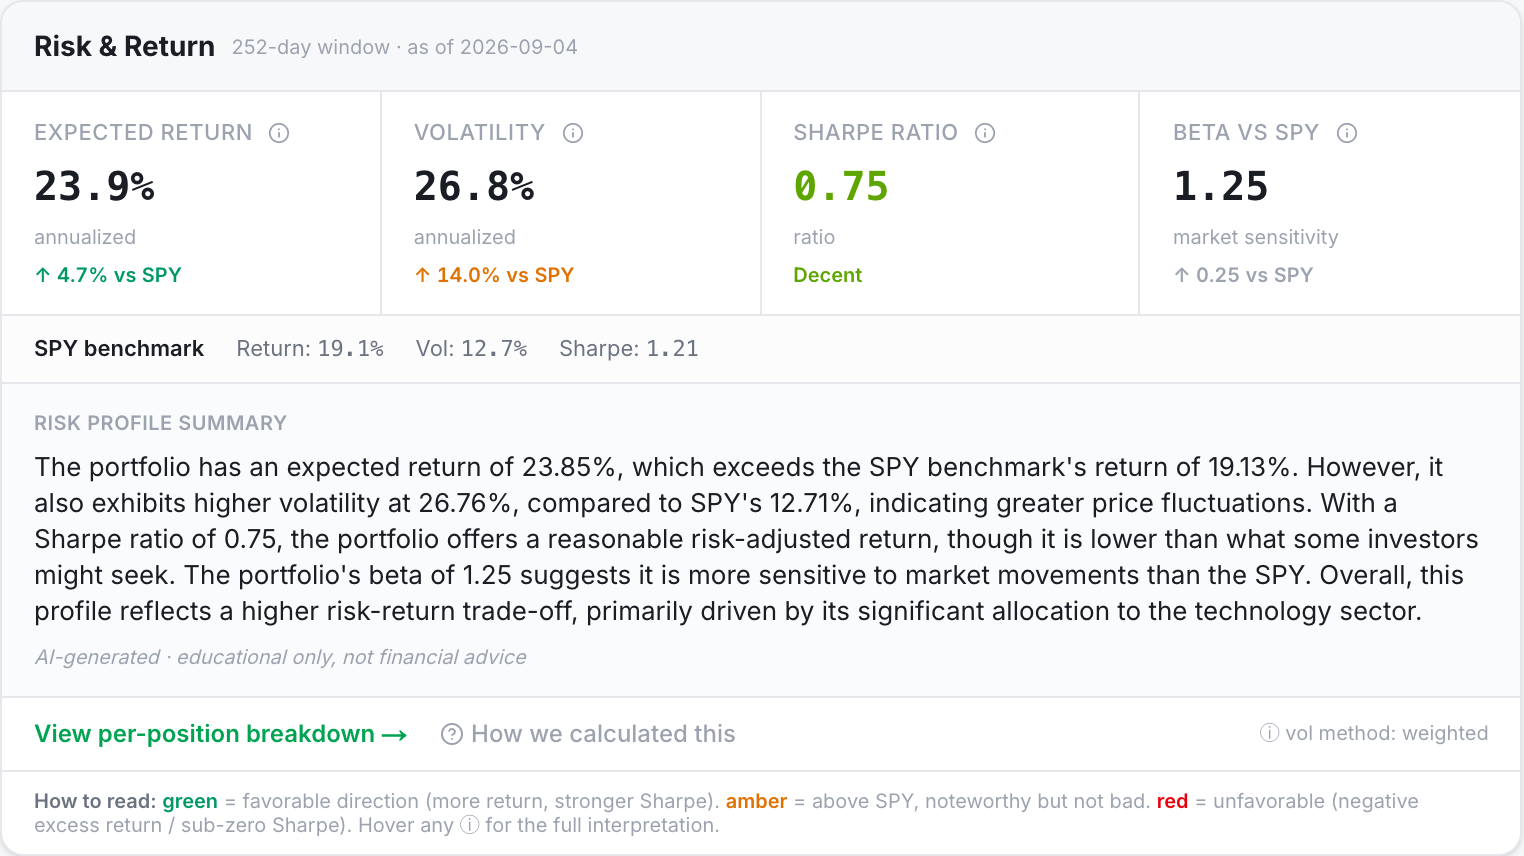
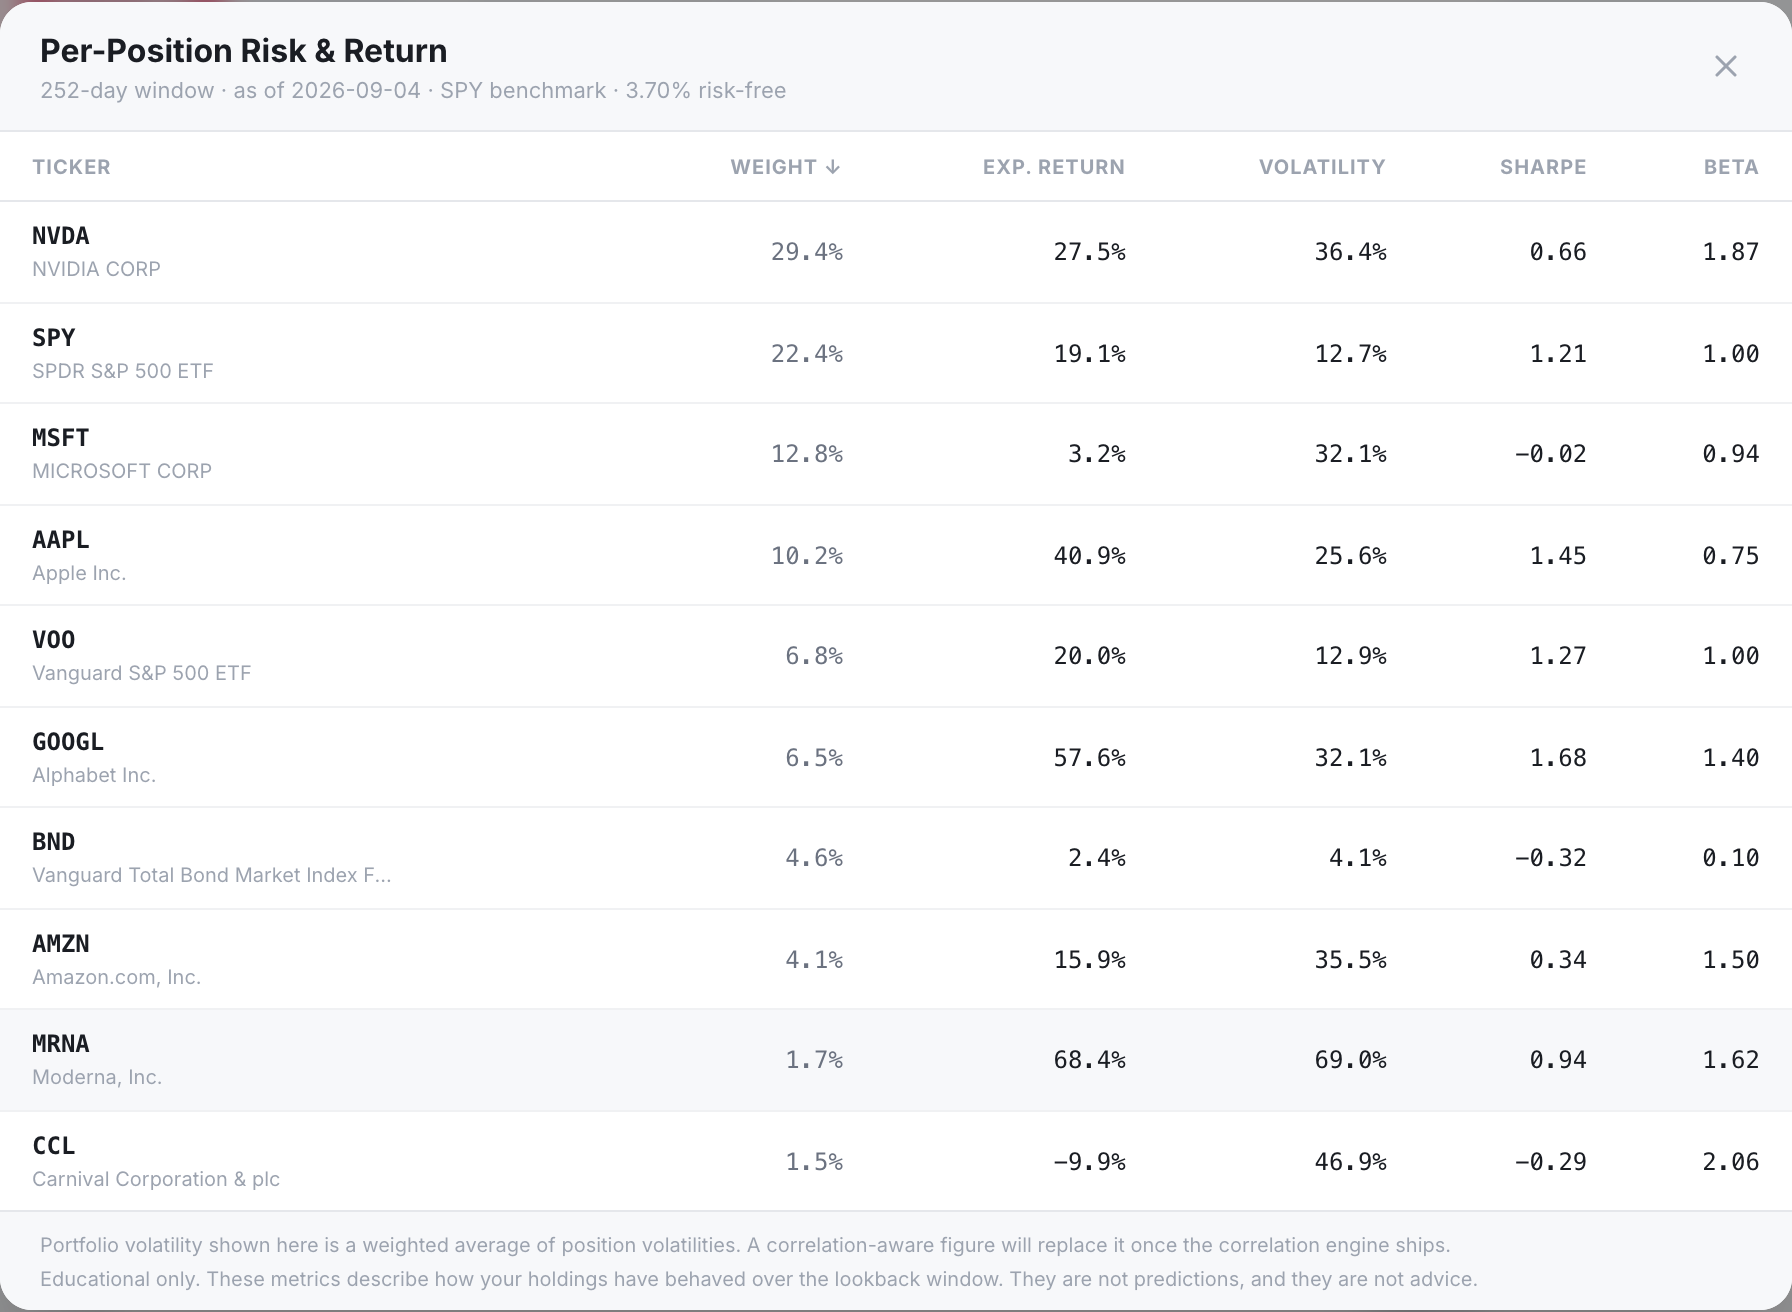
Here is how to read that card the way a professional reads a risk report. Volatility of 27 percent a year works out to about 1.7 percent on an ordinary day. On a 100,000 dollar portfolio, roughly 1,700 dollars up or down is a Tuesday. A day twice that size, around 3,500 dollars, happens several times a year. A week where the portfolio gives back five or six thousand dollars is not an outlier for this profile. It is inside the shape of the thing. The beta of 1.25 says the same from the other side: when the S&P 500 has a 0.6 percent week, this portfolio was never going to have a 0.6 percent week. And when the tech slice broke, the per-position table on the paid plans shows exactly which holdings carried it. On the demo, the largest position carries a beta near 1.9 and volatility above 36 percent, and it sits at the top of the list when you sort by beta.
That is the whole point of the card. It will not tell you the rout is coming. Nobody's card does, and anyone who says theirs did is selling something. It tells you, in advance and in your own numbers, what a rout will feel like in your account, so that the figure on your screen on a Friday afternoon is one you had already seen in a calmer week. Every tile has a walkthrough that shows the arithmetic from your own closes, so you never have to take the number on faith.
A reality check for your own portfolio, not a prediction
We put insight, not advice, on every surface, and a week like this is where it earns its keep. Moneyta will not tell you to trim technology, and it will not tell you to buy the dip. Those are your decisions, or your advisor's. What it does is make sure the decision is made with the numbers in front of you:
- Run an analysis after a week like this and read the observations again. If the chip names fell more than everything else, your technology weight fell with them. The number moved even though you did nothing, and that is worth knowing too.
- Open the per-position table and sort by beta. The holdings at the top are the ones that will decide your next narrow week as well.
- Test a change before you make it. The What-If tool shows what a trade does to concentration, sector weight and your score before any money moves, so you can see whether the change you are tempted by actually changes the shape.
- Set a concentration alert, so the next time one position quietly grows past a fifth of the portfolio, you hear about it in a quiet week rather than a loud one.
Check your AI stock exposure today
Whether or not the AI bubble is bursting, the fastest way to know what last week did to you, and what the next one could do, is to paste in what you own and read what comes back. The Free plan gives you a Moneyta Score, Goodwin's top observations and the Risk & Return card in about a minute, with no card required. If you were surprised last week, the goal is simple: never be surprised by your own portfolio again.
See your own exposure before the next week like this one.
Start freeEvery new account starts with 14 days of Gold: every feature on, no card. Then Free, unless you choose a plan.
Frequently asked questions
Is the AI bubble bursting in 2026?
Nobody can say yet. In October 2026 the biggest AI and chip stocks lost about five trillion dollars of market value while most of the rest of the market rose, which some strategists call an AI bubble bursting and others call a reality check or a healthy correction. Moneyta does not forecast the market. It shows how much of your own portfolio is exposed to the AI trade and how hard it has historically moved, so the answer that matters to you does not depend on which camp is right.
How much did tech stocks lose in the October 2026 selloff?
By Yahoo Finance's calculation, the 47 biggest AI and chip stocks lost about five trillion dollars of market value between October 6 and October 30, 2026, with Nvidia and Alphabet each losing roughly 834 billion dollars. The other 625 large US stocks in that tally gained about 1.3 trillion dollars over the same period. The Nasdaq 100 fell 3.5 percent on October 30 alone, according to Bloomberg.
How do I check my portfolio's exposure to AI stocks and the Magnificent Seven?
Paste your holdings into Moneyta and run an analysis. The dashboard shows your technology weight, flags any single position above 20 percent, counts the pairs of holdings that move together, and the Risk & Return card shows volatility and beta against the S&P 500. The ETF look-through also shows how much of a fund you own is really Nvidia, Apple, Microsoft and the other large names.
What is the Risk & Return card in Moneyta?
The Risk & Return card on the Moneyta dashboard shows four portfolio metrics computed from the daily prices of your own holdings over the last 252 trading days: expected return, volatility, Sharpe ratio and beta against the S&P 500 (SPY). Each tile is compared with the benchmark and has a walkthrough that shows the arithmetic. Paid plans add a per-position breakdown.
What does beta vs SPY mean for my portfolio?
Beta measures how much your portfolio moves when the S&P 500 moves. A beta of 1.0 means it moves one-for-one with the index. A beta of 1.4 means a one percent market move is typically a 1.4 percent move in your portfolio, in both directions. A beta below 1.0 means it moves less than the market.
Does Moneyta predict stock market selloffs?
No. Moneyta does not forecast market moves. It describes your portfolio's exposure and its historical behavior, such as sector concentration, positions that move together, volatility and beta, so you know in advance what a selloff is likely to feel like in your own account.
What does the High technology concentration observation mean?
It is an observation Moneyta's narrator, Goodwin, shows when technology holdings make up more than 40 percent of a portfolio. It states the exact percentage and notes that the sector is sensitive to interest-rate changes. It is a description of exposure, not a recommendation to change it.
Is the Risk & Return card available on the Free plan?
Yes. Every Moneyta plan shows the four portfolio-level tiles over a one-year window. Silver and above add the per-position table, and Gold adds a written narrative of the numbers.